Fuel System Topics
Modern air/fuel ratio sensors can sometimes bring a little bit of confusion as they can be hard to test.
You certainly can't test amperage with them using a lab scope. You really have to check in the scan data to see what that air/fuel ratio sensor is doing and whether or not it's actually working properly.
So let's go through a little bit of a description of how they work and then we'll go through the scanner and see how to test them.
Let's get into some information about how they work first. There’s a good place for that, if you have a scan tool with Guided Component Tests.
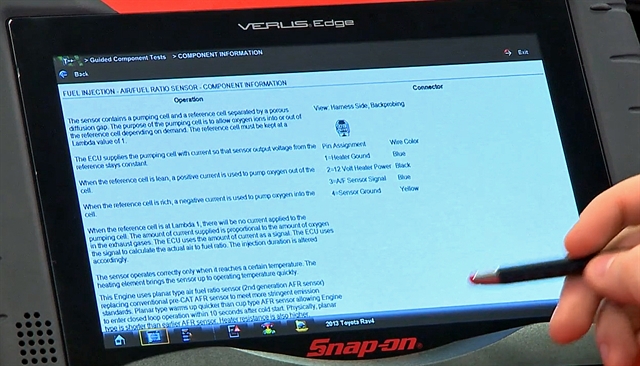
With the tool hooked up to our vehicle, a Toyota Rav4 for this example, we'll go in to the Guided Component Tests menu, to the Fuel Injection System, and there it is – Air/Fuel Ratio Sensor.
The first thing to go to is Component Information once we open a component, so we'll go in there and see how it works.
The sensor contains a pumping cell and a reference cell separated by a porous diffusion gap. So basically it's like two oxygen sensors together in a sandwich.
The purpose of the pumping cell is to let oxygen into or out of that reference cell, depending on whether it's needed or not.
The computer is always trying to keep that reference cell at a lambda value of one or a metric which would be 14.7 to one air/fuel ratio.
So to do that, the ECU supplies the pumping cell with a current so that the sensor output voltage from the reference stays at a constant. It's trying to keep that reference voltage the same.
When the reference cell is lean, a positive current is used to put more oxygen out of the cell. When the reference cell is rich, a negative current is used to put oxygen in to the cell.
When that reference cell is at lambda one, there'll be no current applied to that pumping cell. So the amount of current supplied is proportionate to the amount of oxygen in the exhaust gases.
The sensor operates correctly only when it reaches a certain temperature, so these things get pretty hot, pretty fast.
With these newer ones it's within 10 seconds. It's hot enough to start and it's over 1,250 degrees.
Also remember, output is opposite of what you'd see with a normal oxygen or a conventional oxygen sensor.
It’s a higher voltage under lean conditions and lower voltage under rich conditions, which is the opposite of how a normal oxygen sensor would work.
It also reacts a lot faster to these AFR sensors and you're usually going to see, because the signal lines are biased with about 2.9 to 3.3 volts. So when it's just sitting there, you'll see roundabout 2.9 to 3.3 volts.
So with our tool hooked up to the vehicle, let's go into the scanner and see what data we can retrieve. Go into Engine then Data Display AF Sensor Data.
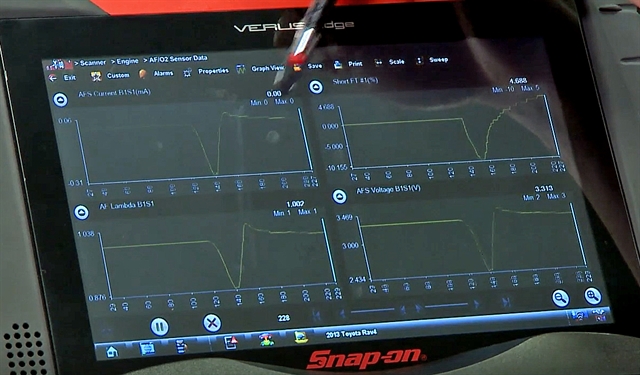
A whole bunch of data is shown but we don’t really need a lot of it so let’s pare it down using a custom data list. Hit Custom, then deselect everything, and in this instance we just need to select AF Lambda, AF Current, AF Voltage. Plus, I’d also like to see what the Short Term Fuel Trim is doing in relation to those.
Go back to the list and graph them all up if you want. You then need to start up the vehicle and see what the graphs show.
You see there's where it started up, at idle, and the computer is trying to keep that lambda back to around one.
So right now we're looking at 1.0 and notice how the current, like it said before, there's going to be no current flowing through as long as that lambda is close to one.
And we can see also the voltage is roughly round about 3.3 volts there. So it's behaving exactly as it would tell us.
So if you hit the throttle a couple of times you can see how quickly the graphs react. Three quick jumps in succession. Everything follows everything else. The short-term fuel trim reacts very quickly.
And this is the reason why these vehicles are so good with fuel economy and can adjust their fuel so quickly, by using those AF sensors.
Read how a fault in a Ford Focus's diesel particulate filter sensor was diagnosed, repaired and verified using a diagnostic platform from Snap-on.
By Damien Coleman
A 2011 Ford Focus with a 1.6L common rail diesel injection system had the engine management light illuminated and a fault code was retrieved with the aid of a Snap-on scan tool.
The fault code was:
| ● | P0473: Exhaust gas differential pressure sensor signal – short to positive or open circuit |
The most important clue with this fault condition was that the fault would not clear with the ignition on (key on, engine off).
This was indicative of an electrical fault with the circuit. A mechanical fault would have cleared initially but instead it re-appeared when the engine was started.
The first step was to test the supply voltage and ground circuit. This found that both were functioning correctly.
The next test was to measure the signal voltage, which showed 4.8 volts on the signal wire from the engine control module.
This was with the sensor plugged in and disconnected.
This voltage is supplied from the control module and the sensor output voltage can “pull” it down depending on output voltage from the sensor.
This explains the fault code’s sub-code: short to positive or open circuit.
The sensor was removed from the vehicle, which was then supplied with a 5 volt supply and a ground. There was no output voltage from the sensor, indicating the fault.
A new sensor was received and again it was supplied with a 5 volt supply and a ground.
This time it measured 0.4 volts on the signal wire and the voltage increased when applying a positive pressure to the sample pipe which detects the pressure upstream of the filter.
The sensor was fitted to the vehicle and the fault code was cleared with the scan tool. A test drive validated the repair.
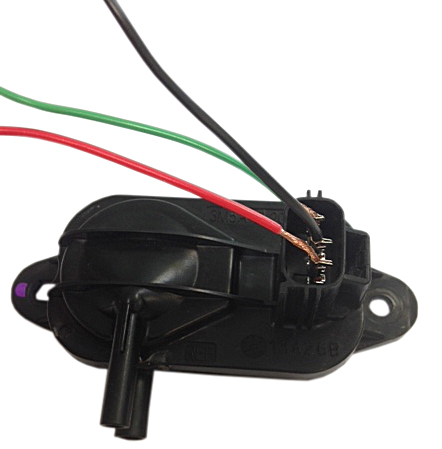
The image below shows the DPF sensor during testing the output voltage:
Diagnosing a fuel pump problem can be pretty troublesome, especially if it's set back in the tank and you've got to drain the fuel tank before pulling the pump out.
Wouldn't it be nice to have a nice easy way to actually check the fuel pump from anywhere in the circuit and see how it's operating just by looking at the pattern on a lab scope?
There is in Snap-on scan tools and diagnostic software – and it’s called the Fuel Pump Current Ramp Test.
First of all, connect your low amps probe to the vehicle’s circuit. You can remove a fuse, put a jumper wire in its place and put the amps probe around that wire.
You can use any part of the circuit to run this test so long as the amps probe is around one wire.
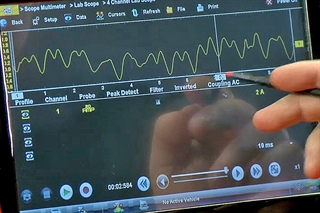
Set up your lab scope to display a two amp scale with a 10 millisecond window then crank the car over in order to generate a pattern for you to assess.
A fuel pump is basically just an electric motor with windings and brushes, and it also has commutators, which the brushes ride on – and that’s what transfers the electricity.
Almost every fuel pump you’re ever going to come across has eight commutators in it, so on your pattern you should be able to count out eight bumps, each one denoting one of the commutators in the motor and each set of eight being one revolution of the motor.
If you have at least eight bumps in a 10 millisecond window then you know it’s turning sufficiently fast as it’s hitting at least 6,000rpm.
Most regular fuel pumps are going to run at between 5,000 and 6,000rpm but if they drop to around 3,000rpm, you are going to run into some driveability issues.
You want to make sure that all of the bumps are nice and even. If they are not, that would indicate that the fuel pump is on its way out and should be replaced as soon as possible.
It doesn’t take long to hook up your lab scope and generate the readings so don’t overlook what is a quick and easy way to help diagnose fuel pump issues.
By Damien Coleman, Product Manager / EBI Specialist
The rise in demand for ‘high-tech’ vehicles has challenged engineers to rethink and create more sophisticated internal systems which promote efficiency. The humble motor is a great example of this with many vehicle manufacturers now using brushless direct current (DC) motors in automotive applications.
The brushless motor has many advantages when compared to conventional ‘brushed motors’:
| ● | It produces less noise since interaction between the brushes and commutator is no longer a factor |
| ● | No electrical arcing takes place |
| ● | There is a greater service life, in theory this motor should last the lifetime of the vehicle |
Whilst more efficient, the commutation control of the brushless motor is more complex.
Brushed Motor Operation
A conventional ‘brushed motor’ uses two brushes (one positive and one negative) to allow current to flow to the armature of the motor. The reason for this is that a magnetic field must be setup within the armature winding which opposes the magnetic field generated by the permanent magnets, these are attached to the motor casing (yoke). The opposing magnetic fields will cause the armature to rotate due to the repulsion/attraction of the magnetic field.
The polarity of the current flow through the armature is ‘switched’ by the commutator segments, these segments provide the link between the brushes and the armature. This allows for constant and smooth rotation of the armature while the current is flowing through the motor.
Understanding the Brushed Motor Waveform
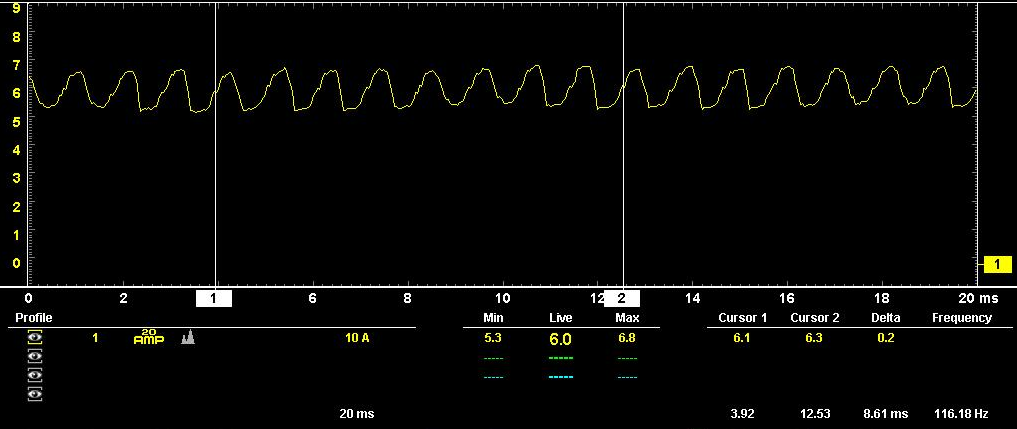
Figure 1: Brushed Motor Waveform
Figure 1 shows the current flow through a “brushed” fuel pump from a Ford Focus. The commutator has eight segments, each segment has a slightly different current profile. By identifying one segment we can use the cursors to calculate the time for one revolution of the pump. In this example the pump speed is 8.61ms for one revolution. This equates to almost 7,000 RPM. The calculation for this is, there are 60,000ms in one minute, so  RPM.
RPM.
A blockage in the fuel system will result in lower speed and higher current flow, whereas a leak within the fuel system will result in higher speed operation and lower current flow. Occasionally a vehicle may present with low fuel pressure with no visible leak. An area that should be investigated is the pipe from the fuel pump to the top of the tank unit, a leak here will result in fuel leakage within the fuel tank.
Brushless DC Motor Operation
A brushless DC motor requires the polarity of the current flow through each winding to be monitored to ensure the same operation under all conditions. This commutation of the motor is managed by an electronic control module and for accurate operation the module must know the position of the motor so the correct ‘phase’ is energised for uniform operation.
Previously this was achieved by using digital hall-effect sensors on the rotating member of the motor. This resulted in additional hardware and cost. Another method is for the control module to motor the back electro-motive force (EMF) in the un-energised winding.
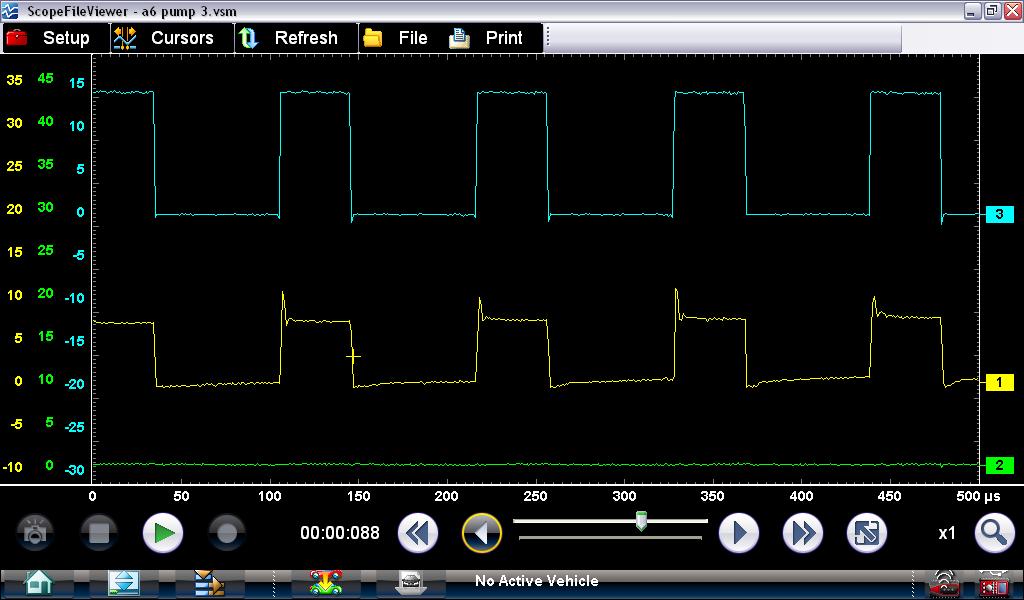
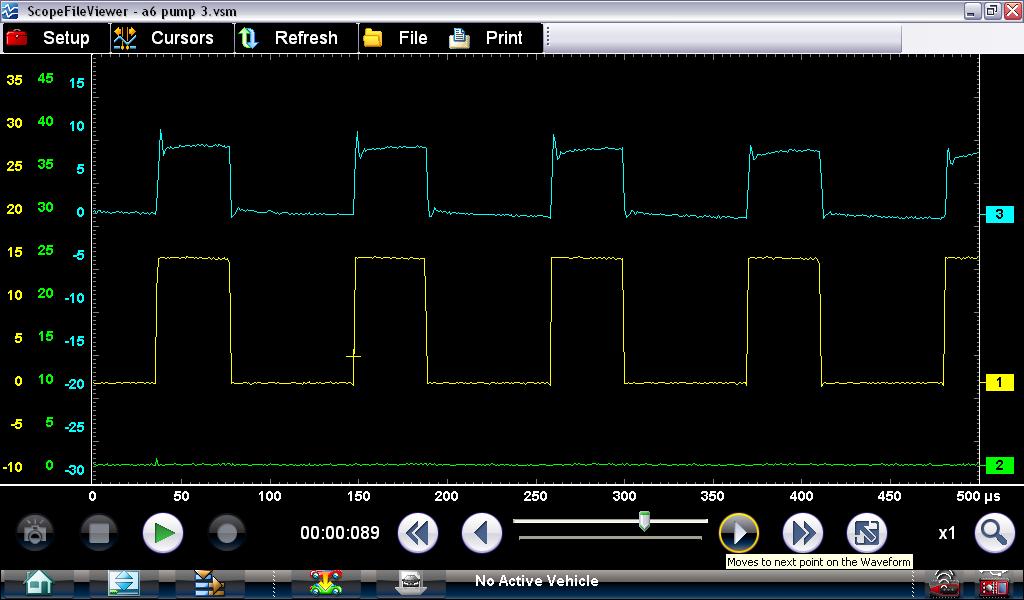
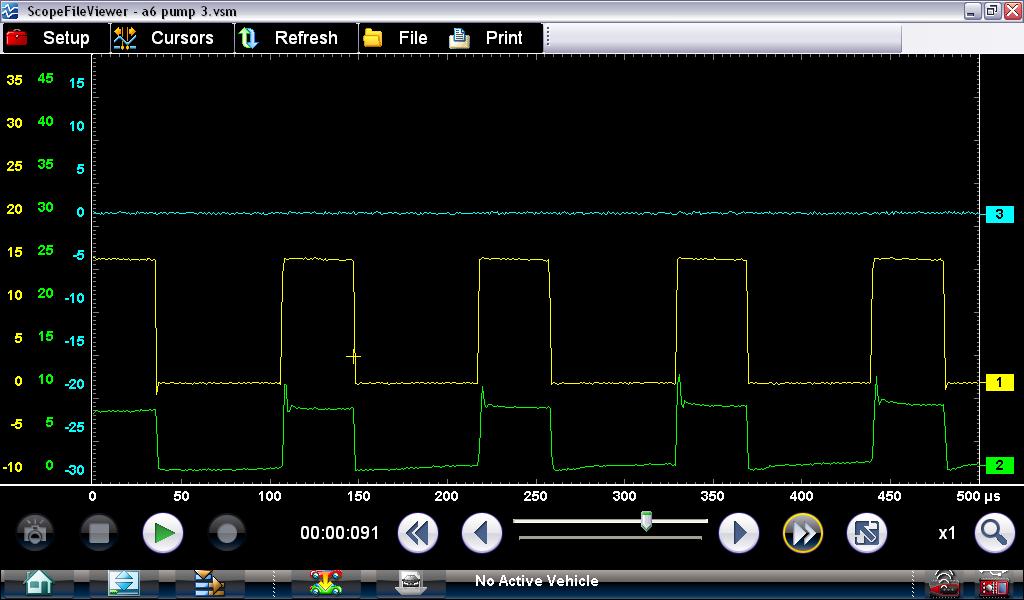
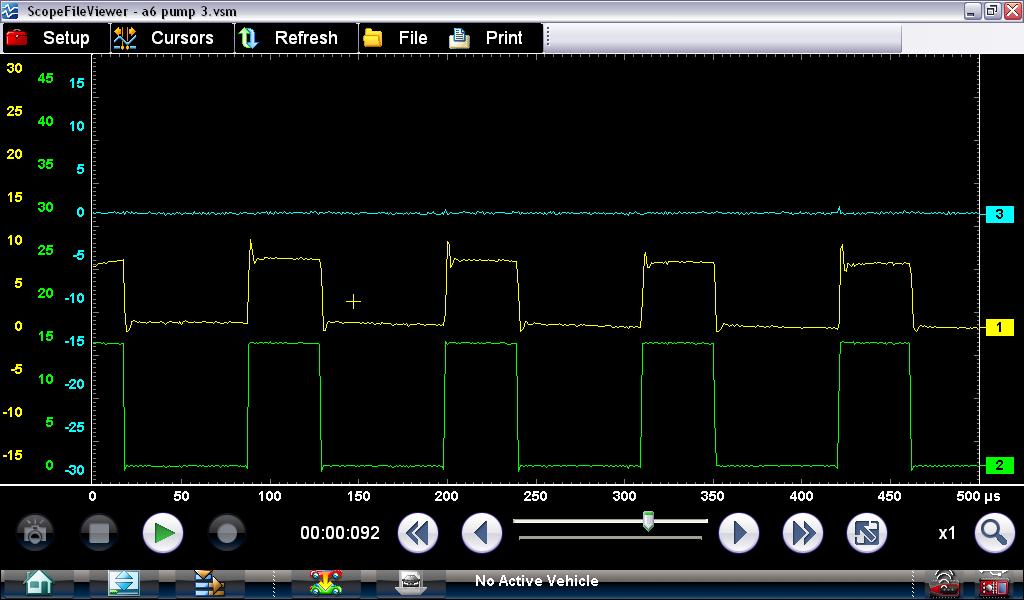
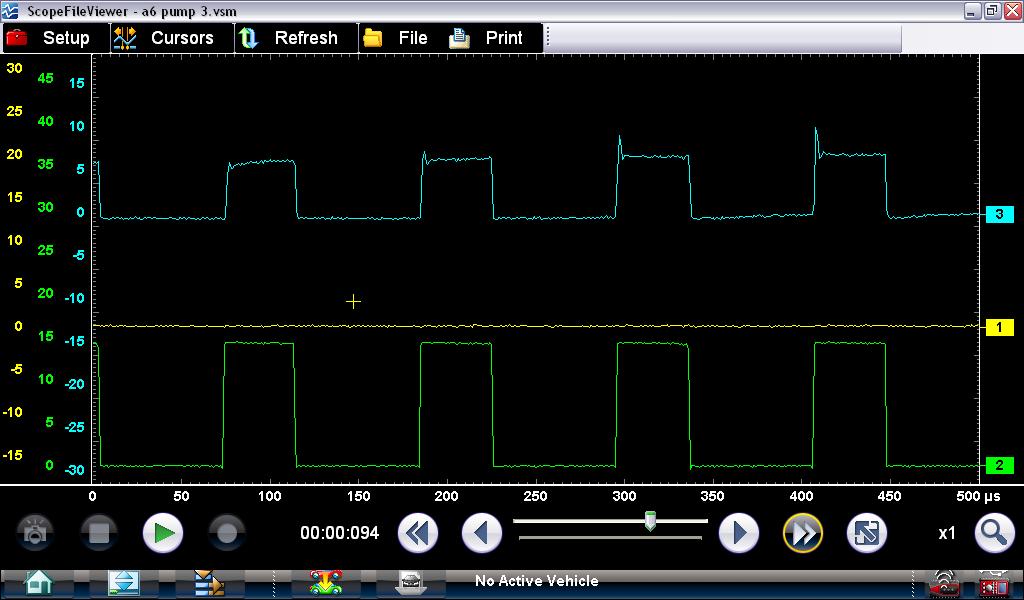
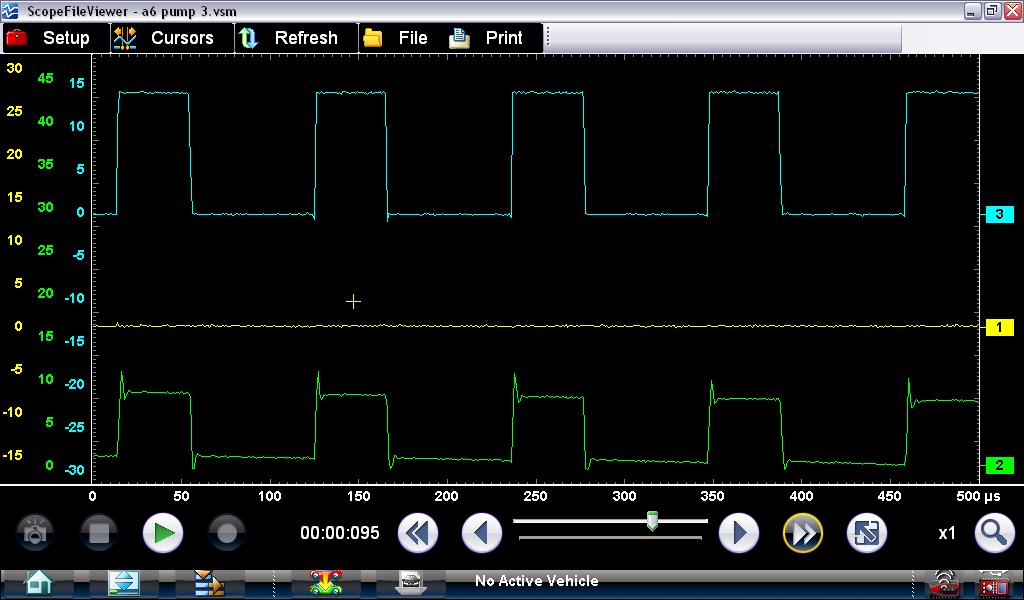
One phase (winding) will be controlled by a positive pulse width modulated (PWM) output from the module while an opposing phase will be connected to a hard ground. This leaves one phase unconnected from the control module at a given time.
Understanding the Brushless DC Motor Waveform
Understanding a waveform is a useful tool in your arsenal to identify the root cause of potential voltage issues in the fuel pump.
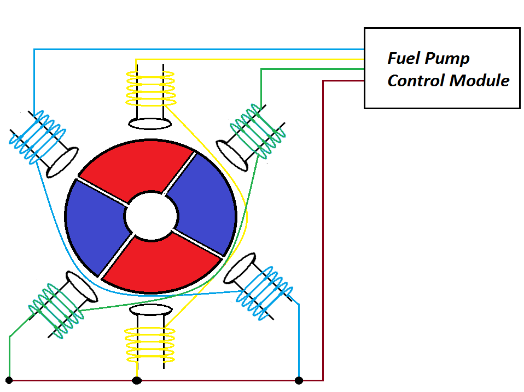
Figure 2 shows an illustration of a fuel pump control module. Note the coloured winding, the yellow, green and blue all respond differently which is explained further below.
Figure 2: Fuel Pump Control Module
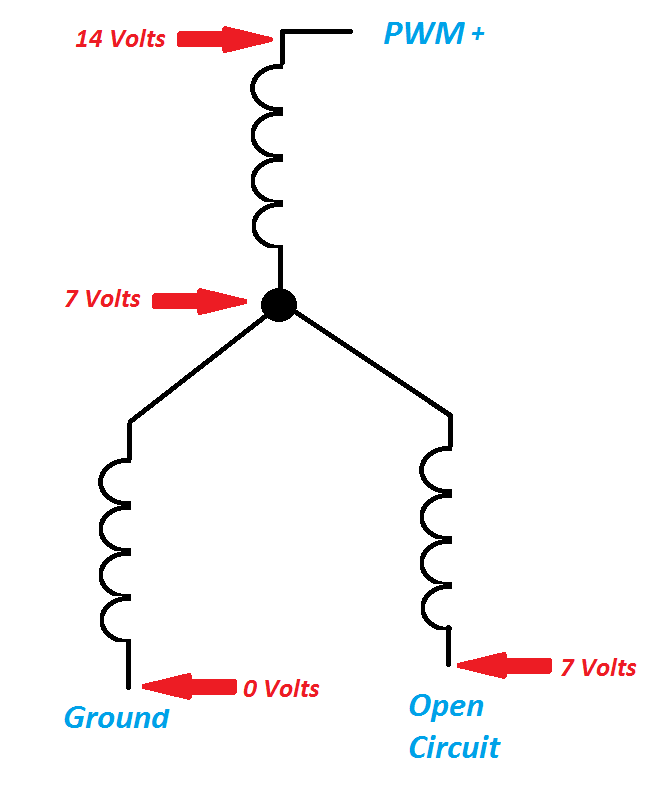
It must be noted that whichever winding is un-energised will have half the applied voltage present during operation. This is due to the connection point being between windings. Kirchhoff’s law states that the sum of the volt drops in a series circuit is equal to the applied voltage. This can be seen in figure 3.
Figure 3: Voltage drop in a series circuit
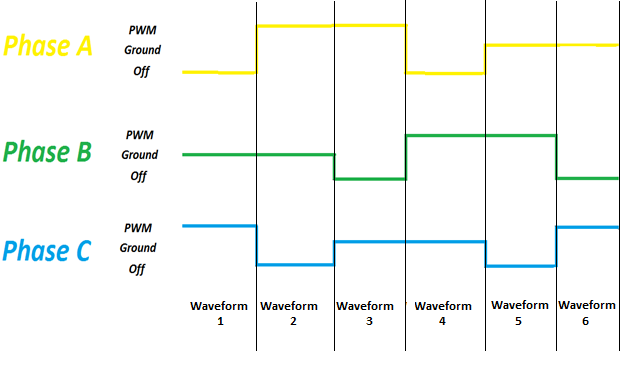
This table demonstrates the module control of each phase during operation. At any one time a phase is on (PWM), connected to ground or uncoupled from the circuit. Figure 4 helps show what that should visually look like.
YELLOW TRACE |
GREEN TRACE |
BLUE TRACE |
|---|---|---|
|
OFF |
GROUND |
PWM |
|
PWM |
GROUND |
OFF |
|
PWM |
OFF |
GROUND |
|
OFF |
PWM |
GROUND |
|
GROUND |
PWM |
OFF |
|
GROUND |
OFF |
PWM |
Figure 4: A visual of the ‘on’, ‘ground’ or ‘uncoupled’ phases
The oscilloscope waveforms below are from a vehicle and can be used to identify the control of each phase during normal operation. These images match the table above.
Waveform 1.
Waveform 2.
Waveform 3.
Waveform 4.
Waveform 5.
Waveform 6.
