General Diagnostic Topics
The ever-developing technology on modern vehicles means that having a solid diagnostic routine can make you more efficient in the workshop.
But what does having a solid diagnostic routine consist of? What are the steps you should be taking when you’re presented with a problematic car?This handy guide from Snap-on®, manufacturer of industry-leading car diagnostic tools and software, talks you through what you need to know – including the benefits of a pre-diagnostic check, before you’ve even hooked up your tool.
Good Diagnostic Habits
Most technicians will agree that one key to their diagnostic success is getting into the habit of following a logical, step-by-step process each time they are trying to locate the cause of a customer’s concern.
It’s about more than simply following manufacturer guidance – it’s a process that allows you to gather as much information as they can quickly and efficiently.
And it takes advantage of all of your senses – including smell, touch and sight – and more importantly the ability to think critically and to analyse all of the information you’re taking in.
The process usually starts by focusing on the customer’s concern but a pre-diagnostic check can help you even further. Here’s how to go about one:
Before you even look at the vehicle, make sure you understand the customer’s concerns
| ● | As you approach the vehicle, try to get a feel for how it's being taken care of by noticing its appearance – both inside and out |
| ● | Once you’re ready to get to work, perform a closer visual inspection with a focus on safety-related items such as the wiper blades, tires, brake pads and all the lights |
| ● | Under the hood, inspect fluid levels and condition, along with the condition of belts and hoses |
| ● | Look for anything that just isn’t the way it should be and make a note of your discoveries so you can share all of your recommendations at once |
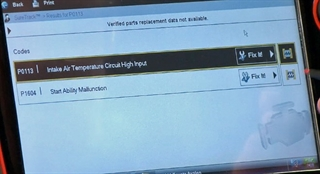
| ● | Then connect your Snap-on diagnostic tool to the vehicle and run a pre-scan report to identify any diagnostic trouble codes (DTCs) stored in the engine control units (ECUs) |
When you're diagnosing a vehicle and you're checking scan data, how are you sure that the data is always 100 percent correct?
You really need to use a lab scope to double check and see what the component's actually doing.
And, wouldn't it be nice if you had a way you can compare them both on the same screen to see what's going into the computer and what's coming out of the computer?
Using a Snap-on scan tool and lab scope, there’s a really easy way to do just that.
With your platform, the ZEUS or VERUS Edge are ideal here, hooked up to the car, first of all take a look at the scanner data to see what’s going on.
Using a 2014 Ford Fusion for this particular example, our National Field Trainer Jason Gabrenas shows the steps you need to follow:
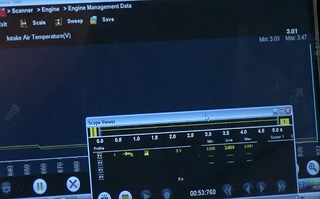
“I have the Intake Air Temperature Sensor Voltage pulled up, so I can take a look at it and see what's going on. This is reading about 3.03 volts.
“I'll actually make that full screen, so it’s a little easier to see there. I also have it plugged in with the lab scope, so that'll tell me exactly, at the component level, what's going on with that sensor.
“If I go into my fuel injection system and I'm going to find the intake air temperature sensor and I want to do a DC voltage test because I'm reading voltage coming out of the scanner so I want to see the voltage going in to the computer.
“We'll click DC Voltage Test, it gives me my pin assignment, shows me what the connector is supposed to look like on the right-hand side. On the left it tells me how to plug in my wires.
“If I scroll down a little bit, and click View Meter, it's going to click, it's going to turn on and now we have a voltage going across the screen.
“I'm going to change that so I can see a little bit of data there. And if I go up and click the Meter button on the top, I can make it full screen.
“And if I click that one more time it's going to turn it into a window so I can adjust it, move it around, do whatever I might need to do to see what I need to see.
“I can go back over to the scanner by hitting the Home key and going back to Scanner.
“The button right next to the Home button is the task bar button. If I press that and see where it says Scope Viewer there on the window I can click that and I can see what's going into the computer and what's coming out of the computer on the same screen.
“So right now I'm getting a live value of 3.06; if I look up here on the scanner says 3.01. We're pretty close, I'd say that's close enough. So we know that this is working.
“What if the computer scanner value was totally different than what I had going in and with my lab scope?
“Well, I'd always say that the lab scope is going to tell you exactly what that component is doing because it's plugged in right at the component.
“If the component's good and the computer's bad, the next thing I would do is unplug the lab scope, follow that wire back where it goes right to the front of the PCM and plug it in there and double check my signal there.
“If the signal's good all the way up to the PCM and it's bad coming out the back of the PCM, you know you've got a bad PCM.
“If it had a bad signal going into the PCM, maybe it might be my wiring, but at least I've verified that the component isn't the problem and it may be the wiring or something else.
“So hopefully that'll help you in some of these voltage issues or some other issue you might be dealing with in your diagnostics.”
On a lot of newer vehicles, when you replace a module like a body control module or an instrument cluster, you then have to carry out a procedure in order for the vehicle to recognize that the new module has been installed.
It’s something you’ll face with near enough every vehicle manufacturer and it’s an important task that you need to make sure is done correctly.
FIAT, for example, calls this a proxi alignment procedure and it’s a pretty simple sequence of steps for you to follow.
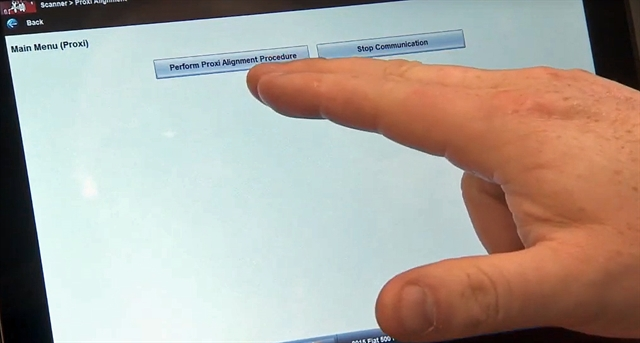
With your scan tool hooked up to the vehicle, go to the Scanner menu then click on Proxi Alignment. Once the tool has identified the vehicle’s ECU you’ll be presented with two options – hit Perform Proxi Alignment Procedure.
Displayed on screen is this message: “This procedure is used to display the proxy configuration status of the entire vehicle and copy the proxy configuration data into any required ECUs. Continue to display the current vehicle status.”
The proxi alignment procedure on FIAT vehicles is an important step for you to complete.
Once you have pressed Continue, you’ll get a list of modules. In this test example on a FIAT 500 we have IPC, Radio, TPM and CTM.
Because we haven’t replaced anything for the demonstration, each one is marked as Configured. If we had changed anything, that message would change to Not Configured.
Again, press Continue, and at the next stage you will be told that a proxi alignment would need to be carried out if you had replaced any relevant components. You would then be guided through the process.
Once that is complete, at the next screen you will be told that in order to complete the process you need to turn the ignition off and wait for the displayed countdown timer to finish.
When the timer is at an end you will be instructed to turn the ignition back on and hit Continue, which is when you will then be told that the proxi alignment feature is complete.
So as you can see, it’s a short procedure and a small amount of button presses and you’re ready to set up a new module on the vehicle.
The software on Snap-on diagnostic tools contains a very useful feature that allows you to take a snapshot of data to show you went on around the time the diagnostic trouble code was triggered.
When a code sets on many models from Asian manufacturers, the scan tool will show you a freeze-frame shot and it will also show you up to three half-second shots before that point and one half-second shot afterwards.
This allows you to see what the vehicle was doing leading up to the code setting and then again in the immediate aftermath – and it’s very easy to access.
Let’s use a Toyota for this example, although the feature is also included in software coverage for some Honda, Mitsubishi and Lexus vehicles.
With your scan tool hooked up to the vehicle and DTCs identified, go into the Engine system and then look for the Freeze Frame option.
That will give you the codes so then you need to locate a small icon that looks like a filmstrip, click on it, and the tool will pull the data from the ECM before displaying it.
The ECM records engine conditions in the form of freeze-frame data every half a second. Some codes will store five separate sets of freeze-frame data.
In this instance, we’ll have three data sets before the code is triggered, one at the exact moment, and one data set for afterwards.
This is very useful as it helps you to simulate the condition of the vehicle around the time that the problem occurred.
With the data on your screen, continue and then you will be given a description of what the PIDs are.
You will then be able to move between the different data sets, meaning you will be able to see a clearer picture of what was happening before, at the point of, and after the code being set.
It’s a pretty handy little feature for helping you to figure out exactly why the code was set.
A very handy feature of the diagnostic software on your Snap-on scan tool is the Parameter Identification (PID) trigger function.
Read on to learn how a Snap-on diagnostic tool gives you a simple way to monitor vehicle data when carrying out a road test as part of a repair.
A very handy feature of Snap-on’s diagnostic software is the parameter identification (PID) trigger function.
This helps you to keep track of the data produced by the vehicle while you’re carrying out your diagnosis, meaning you don’t need to keep watching your scan tool’s screen or have someone else helping you out.
You can set minimum and maximum values and if your data goes outside of those the PID trigger function will automatically save it for you so you can see it later.
For example, let’s work with a vehicle’s intake air temperature sensor and connect it to a Snap-on VERUS Edge scan tool.
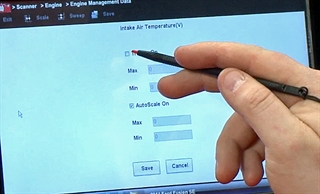
Once you have the data on your tool’s screen, tap on the wrench icon to the left and you can turn the triggers on with your maximum and minimum figures.
Let’s keep the minimum as 0 volts and enter 4.5 volts as the maximum then save, and back on the graphs screen tap on the camera icon to activate those levels.
If you disconnect the sensor from the vehicle the reading goes above the maximum line, then the scan tool records a few more frames of data before saving it, so you don’t have to keep checking the screen.
A green line then shows at what point the data was saved, and in the tool’s settings you can tell it how many frames of data you want it to record after the readings have gone beyond the minimum or maximum levels you set up earlier.
Once you have this set-up it will save you a lot of time when it comes to recording data and diagnosing your vehicles.
– Damien Coleman, Product Manager/EBI Specialist.
2020 marked the Snap-on’s 100th year. To mark this incredible milestone Snap-on released a graphic to celebrate the occasion:
A symbol appears in both zeros of the one hundred. The first zero has a hexagonal centre to symbolise a socket, this is a link to the origins of the company and the “Game Changer” that is the interchangeable socket. The second zero has the on/off symbol. This shows how Snap-on has adapted to the ever changing landscape of the automotive repair industry and the importance of diagnostic tools to the industry.
The reason we have a 1 and 0 in the On/Off symbol is a link back to the binary system. Interestingly there is a pertinent link between the Binary System, Snap-on Diagnostics and Cork, Ireland.
Snap-on Diagnostics has an office in Cork. This facility is one of several Snap-on global engineering sites with a proud history of R&D and innovation. The link between Cork and the Binary system dates back further still, in fact all the way back to 1849!
A university professor named George Boole, born in Lincoln England, moved to Cork in 1849 and became the first professor of mathematics in University College Cork. In 1847 Boole introduced his work on Boolean algebra in his first book, The Mathematical Analysis of Logic.
In its most fundamental form Boolean algebra is based on a mathematical statement being either true or false, on or off, 1 or 0. This logic is fundamental to the operation of modern computing technology.
In recent times, advances in data transfer between electronic control modules on motor vehicles has allowed various systems within the vehicle to communicate at data transfer rates previous impossible.
Boolean logic
Electronic control modules process data from various sensors and modules controlling multiple systems. Control modules operate on the principle of Boolean logic (the binary system), this is where a statement is either true or false. True is identified by a logic 1 and false by a logic 0. Another set of terms often used are high and low. High relates to logic 1 and low relates to logic 0. High and low is the most suitable terminology because the signal 0 and 1 is actually a voltage applied to an electronic device. One or two inputs (depending on the device) are applied to a component called a logic gate, there is a single output from the gate.
We will look at some simple logic circuits and analyse the inputs/outputs in a truth table. A control module will have in the order of several million such devices within each processor.
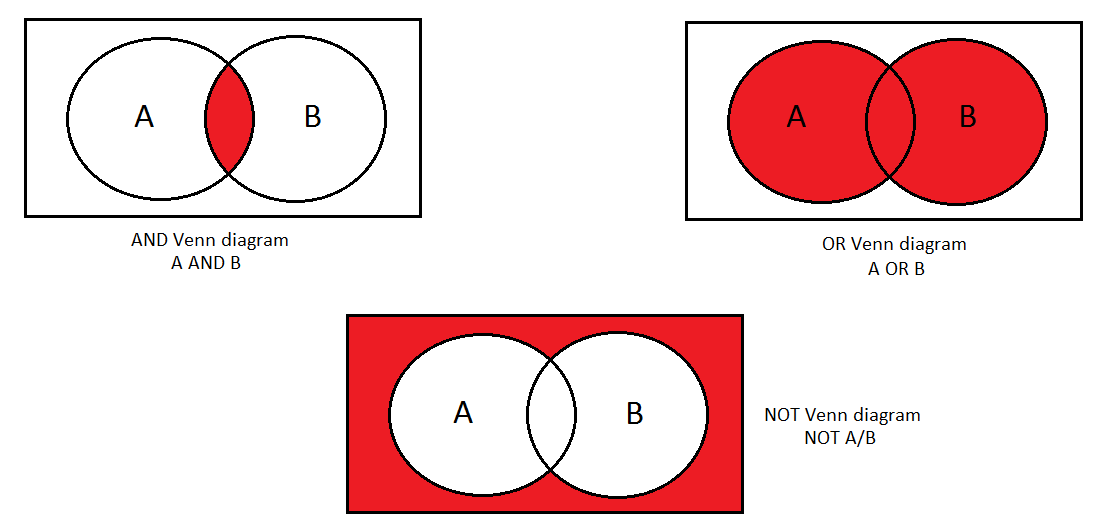
AND diagram.
| ● | The common area between A and B indicates an output that is applicable to both A and B. |
OR diagram.
| ● | This relates to an output that is applicable to A or (and) B |
NOT diagram.
| ● | This relates to an output that is not applicable to A or B. |
Switched Circuit Theory
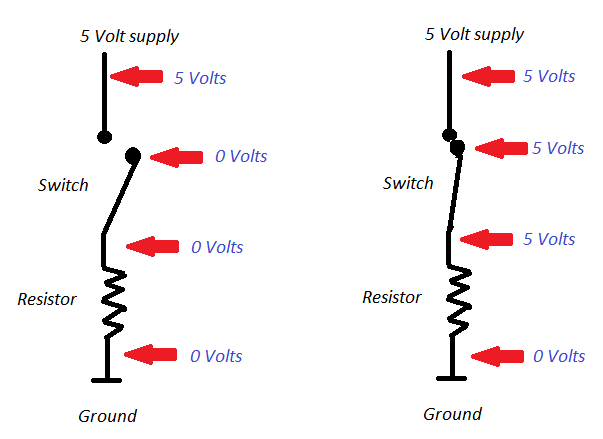
Prior to looking at a transistor operated device, we can use a mechanical switch to get an understanding of the voltage at different points.
Switch Open. Switch Closed
Now that we have an understanding of the theory behind logic gates we can analyse an electronic version of each circuit.
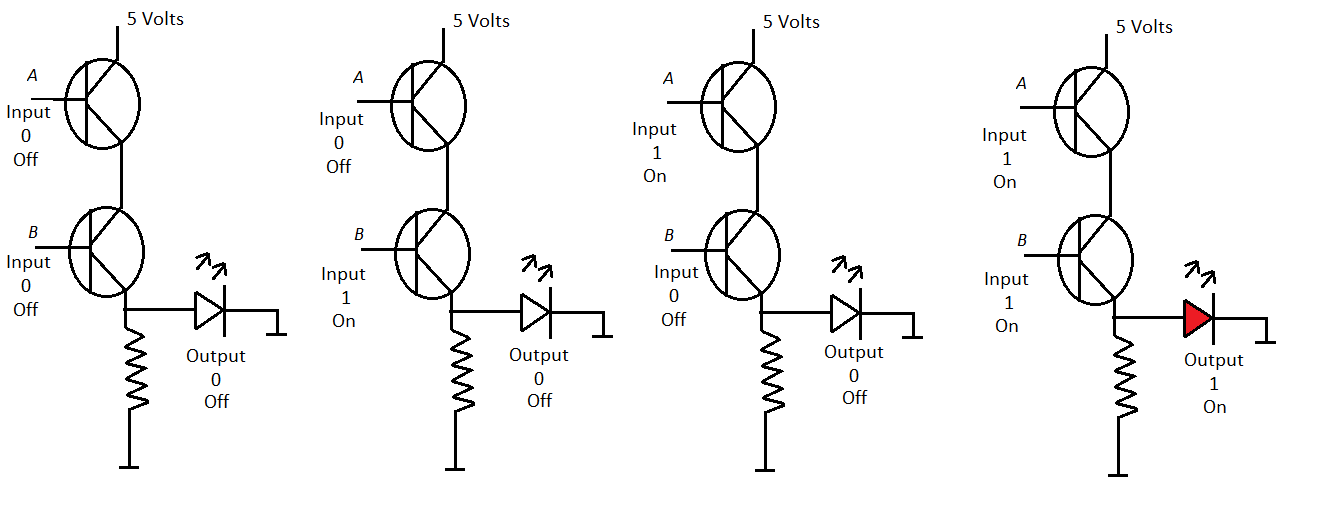
AND Gate
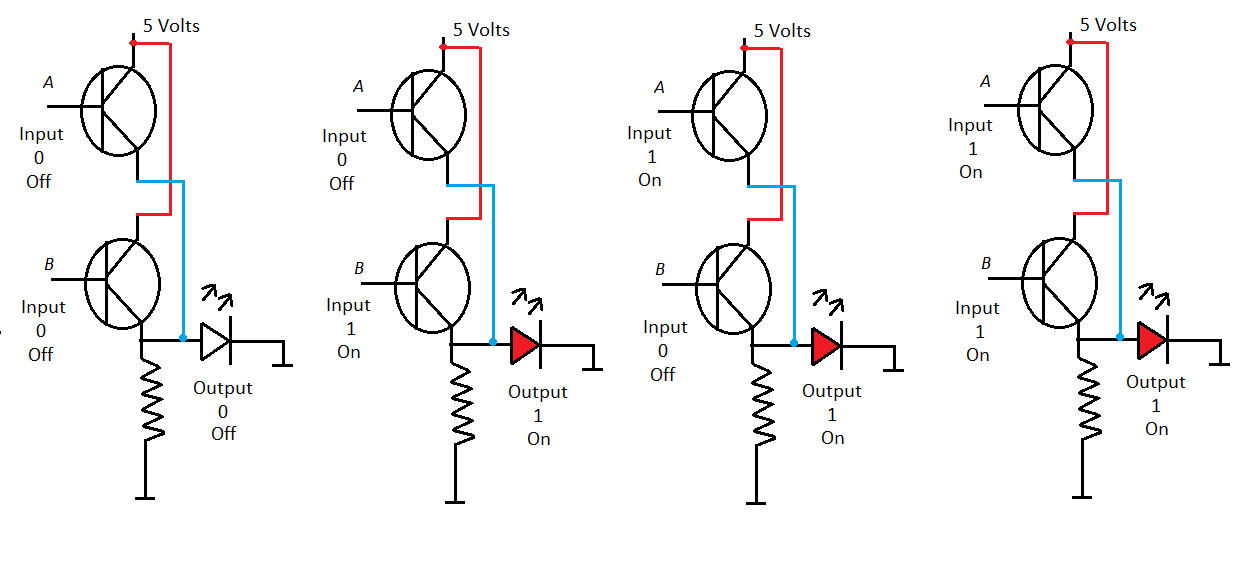
This circuit uses two transistors which are connected in series with one and another, the emitter of the first transistor is directly connected to the collector of the second transistor. A light emitting diode is connected to the output as a visual reference. The emitter of the second transistor is connected to ground via a resistor. The output connection is on the ground side of the second transistor but upstream of the resistor. The applied voltage (5 volts) is connected to the collector of the first transistor. It can be seen from the illustration that even if (only) one of the transistors is switched on, by applying a voltage to the base/emitter circuit, current cannot flow from the supply to ground. It can be seen that there is no voltage applied to the light emitting diode so the LED remains switched off. Only when both transistors are switched on can current flow to ground via both collector/emitter circuits.
OR Gate
This circuit uses two transistors which are connected in parallel, both collectors have an independent 5 volt supply and both emitters can allow current to flow to ground separately. Again a light emitting diode is used as a visual reference. A voltage is measured at the output point when any one or both transistors are switched on. Again note the output is connected upstream of the resistor.
NOT Gate
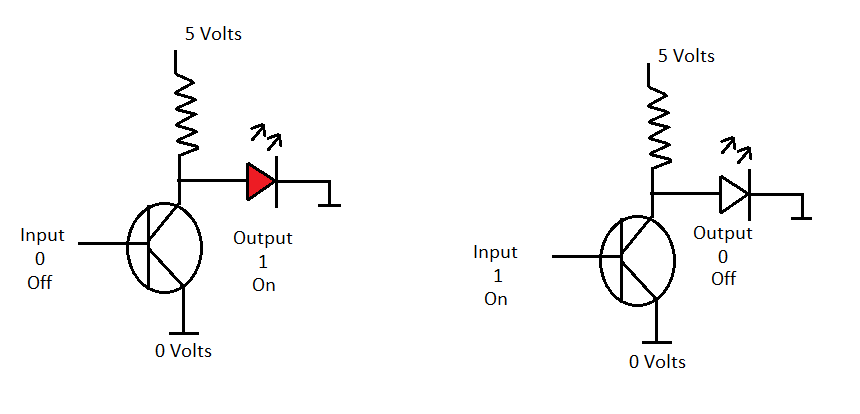
A NOT gate differs from both the AND/OR gates because there is only one input, as with other versions there is only one output. The NOT gate is also referred to as an inverter. This is because the output is the inverse of the input. When a logic 0 is applied to the base of the transistor, the output is logic 1. So when the transistor is switched off, a voltage is available at the output point. The reason this device works is because the resistor is connected between the 5 volt supply and the collector of the transistor. Note, there will be no volt drop across the resistor if current is not flowing within the collector/emitter circuit. When the transistor is switched off there is no path to ground for the current to flow.
A simplified practical example of a AND, OR and NOT Gate is displayed below:
AND Gate
OR Gate
NOT Gate
Example Controller Area Network (CAN) Bus waveform
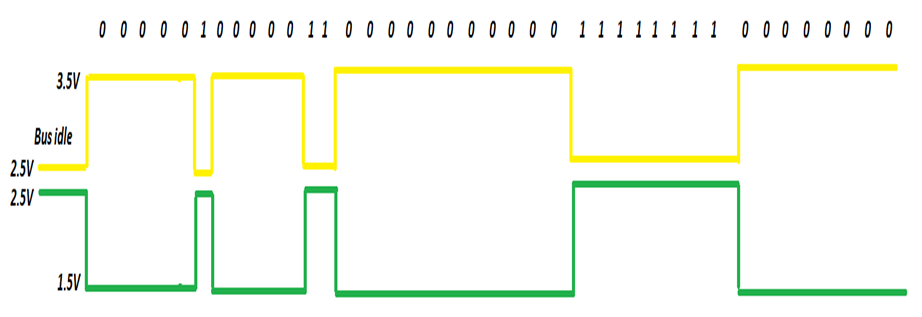
CAN bus uses a different method to assign a numerical value to the bus voltages. A dominant bit, of zero is set, when the CAN High voltage is 3.5 volts and the CAN Low voltage is 1.5 volts. The recessive state, given a value of 1 is when the voltage on both CAN High and CAN Low is 2.5 volts.
The binary system is still fundamental to the operation of the system.
Example Local Interconnect Network (LIN) Bus waveform:
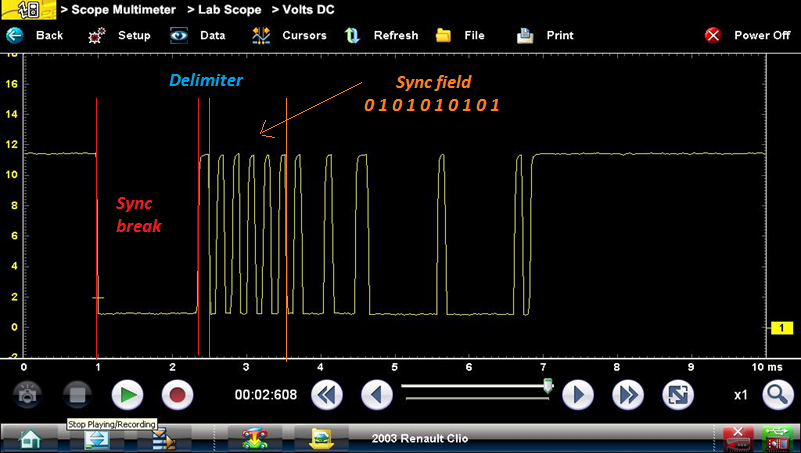
LIN Bus has an idle voltage of approximately battery voltage. During communication the module pulls the Bus voltage towards ground potential, this is a dominant (1) bit. To ensure correct message timing the master LIN node synchronises the other modules on the network with a 10 bit Synchronisation field.
LIN Bus status vs voltage levels
| ● | Dominant State – Level 0 – Bus Low (Low Voltage). |
| ● | Recessive State – Level 1 – Bus High (High Voltage). |
Pre- and post-repair vehicle system scans have become a very useful step in a workshop’s diagnostic process.
Running a pre-scan before any vehicle work is done means any hidden issues can be located and the customer can be made aware of them from the outset.
The pre-scan code identification helps speed the diagnosis and repair, and when it is followed by a post-scan after work is finished, the report confirms that all concerns were dealt with properly.
Being able to give customers a copy of their reports also provides extra satisfaction as they can take away an easy-to-read statement of what was discovered and subsequently resolved.
Reports can also be printed or e-mailed to customers as well as used to fulfil mandates by manufacturers and many insurance companies for pre- and post-collision work.
Pre- and post-scan reports can be carried out on the Snap-on ZEUS® and APOLLO-D8™ scan tool, along with the VERUS®, MODIS™, SOLUS™ and ETHOS® families of products.
APOLLO-D8, MODIS Edge™, MODIS Ultra™ and SOLUS Edge™ users can benefit from automatic synchronization of reports to the Snap-on Cloud system on altusdrive.com.
From there, reports can be printed, e-mailed or sent via text message to customers and insurers, and can be accessed quickly in the shop.
Be More Efficient
So as you can see, by taking the time to fully gauge the condition of the vehicle you can make more efficient decisions when it comes to the repair of the customer’s original concerns and locating as-yet unidentified issues that the customer needs to be aware of.
With the ever-growing use of advanced safety systems and other electronics, your customers are increasingly dependent on you to keep their vehicles – and ultimately their families – safe.
Learn more about the full range of diagnostic tools and software from Snap-on.
The topic of diesel emissions – and in particular nitrogen oxides (NOx) – has become a major talking point in recent years.
Understanding the ins and outs of the systems that help reduce these emissions has never been more important for a technician.
But what is NOx? And how do you diagnose NOx problems? There are several factors you need to be aware of if you are trying to get to the bottom of such an issue.
Nitrogen and oxygen are present in the atmosphere so both diesel and gasoline engines are affected.
During combustion, these elements combine in an endothermic reaction to form nitrogen oxides, or NOx.
The amount of NOx formed varies with the peak combustion temperature – as that rises, so does the rate of NOx formation.
Diesel engines produce more oxides of nitrogen due to the engine operating on excess air; this is due to the absence of a conventional throttle valve.
Oxygen and nitrogen react in the presence of high temperatures and combustion pressures to form NOx gases.
The temperature in a diesel engine’s combustion chamber can reach as high as anywhere between 1,500°C and 1,800°C, which is optimal for the formation of NOx gases.
How is NOx treated?
NOx gasses can be treated in two ways:
| ● | The formation of the chemical bond being disrupted during the combustion process (exhaust gas recirculation, internal and external) |
| ● | The reduction of NOx gases using exhaust gas after-treatment devices (catalytic reactions) |
An exhaust gas recirculation (EGR) valve can be fitted to a vehicle. It regulates the quantity of (spent) exhaust gases recycled into the intake manifold.
This method works effectively because the recycled exhaust gases are inert and essentially “dilutes” the fresh mixture charge.
The result is the overall peak combustion temperature is reduced.
The EGR system is operated during conditions where there is a surplus of free oxygen such as part load and cruising conditions.
Alongside NOx, other emissions from diesel vehicles include carbon monoxide, hydrocarbons, sulphur and particle matter.
The current Snap-on diagnostic software upgrade allows you to boost your knowledge of NOx matters with on-screen guidance and technology classes.
These include:
| ● | NOx Accumulator |
| ● | Fuel Additive Versus Urea Solution |
| ● | NOx Emissions |
| ● | Diesel Particulate Filter |
