Fast-Tack® Intelligent Diagnostics
![]() Wi-Fi is Required to Use This Application ! See Wi-Fi Connection*
Wi-Fi is Required to Use This Application ! See Wi-Fi Connection*
![]() Wi-Fi is Required to Use This Application ! See Wi-Fi Connection (new tab)
Wi-Fi is Required to Use This Application ! See Wi-Fi Connection (new tab)
Intelligent Diagnostics provides access to the latest code-specific data, information, and tests, all obtained from actual shop repair orders and industry professionals.
Intelligent Diagnostics may include the following code-specific information and data (if available):
| ● | Technical Bulletins - View Safety Recalls, Technical Service Bulletins (TSB’s), and OEM Campaigns |
| ● | Top Repairs Graph - View a graph of the specific parts and procedures most frequently used to fix the selected code or symptom. |
| ● | Smart Data - View custom code-specific PID lists developed to show you just the data you need related to the code. Smart Data also highlights PIDs that are operating outside known-good values. |
| ● | Functional Tests and Reset Procedures - Test components using command functionality directly from the diagnostic tool and reset service indicators. |
| ● | Guided Component Tests - Test components quickly and accurately with Guided Component Tests that include step-by-step instruction, component specifications and troubleshooting information. |
| ● | Real Fixes and Troubleshooter - View code-specific procedures, tests, and tips that have been gathered from actual shop repair orders and industry professionals. |
|
Fast-Track® Intelligent Diagnostics Opens in a new tab. |
Accessing Intelligent Diagnostics
Accessing Intelligent Diagnostics
Intelligent Diagnostics is accessed by selecting the Diagnose icon from the Scanner code results list. For code results list information, see .
To review basic Scanner operation procedures, see
Intelligent Diagnostics information modules are contained in one multi-card main menu. This allows you to easily select a card (e.g. Technical Bulletins, Smart Data, Real Fixes, etc), view the data and then quickly return to the main menu to open another card.
Some Intelligent Diagnostics functions are similar to Scanner functions and may share navigation and controls instructions. These topics use cross references to the applicable common information.
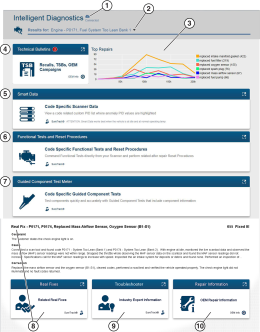
The following descriptions are used with the image below.
| 1. | Wi-Fi Connection Status Indicator - A Wi-Fi connection indicator (cloud icon) is provided on the top of the screen. This icon is also used to indicate service expiration, the icon changes color to red, and displays the word “Expired” in the event your software version is not upgraded to the latest available version. |
| 2. | Code Results Dropdown Menu - Displays selectable list of all present codes. |
| 3. | Top Repairs Graph - Graphical display of the specific parts and procedures most frequently used to fix the selected code or symptom |
| 4. | Technical Bulletins (card) - Lists code-specific Safety Recalls, Technical Service Bulletins (TSB’s), and OEM Campaigns |
| 5. | Smart Data (card) - Displays code-specific PIDs and highlights PIDs operating outside known-good limits. |
| 6. | Functional Tests and Reset Procedures (card) - Perform code-specific functional component tests directly from the diagnostic tool. |
| 7. | Guided Component Tests (card) - Test code-specific components quickly and accurately with Guided Component Tests that include step-by-step instructions, component specifications, and troubleshooting information. |
| 8. | Real Fixes (card) - Provides a list of code-specific procedures and tests that have been gathered from actual shop repair orders and presented in a complaint, cause, and correction format. |
| 9. | Troubleshooter (card) - Opens a list of code-specific tips gathered from industry experts. |
| 10. | OEM Repair Information (card) - Provides a link to and optional information service (e.g. ShopKey Pro). See SureTrack® & Repair Information for information. |
Intelligent Diagnostics Navigation
Intelligent Diagnostics Navigation
Basic navigation is accomplished by selecting the desired menu card.
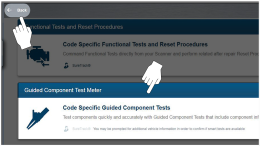
Use the Back icon to navigate back to the previous screen.
To expand a card to full size, select anywhere in the card. .
To close the card, select the Exit “X” icon.
Some applications provide print functionality to print the screen results. Select the Print icon on the right side of the upper toolbar. See Printing / Printer Setup.
Code Results Dropdown Menu
Code Results Dropdown Menu
The Code Results Dropdown menu allows you to quickly choose any of the scanned codes from the code list, without having to exit Intelligent Diagnostics. Select a code to view specific data about that code within Intelligent Diagnostics.
The Top Repairs Graph shows the most common verified fixes using the parts listed.
Example - In the graph shown below, the most common fix for the code was replacing the intake manifold gasket. This fix occurred 413 times, with the most occurrences (85) at 100k miles in vehicles with up to 200k miles.
Depending on the information available, the graph may also include probable causes. See example below “cleaned mass airflow sensor”.
The Technical Bulletins card provides a quick link to OEM Recall, TSB and Campaign information that may be available for the selected code.
| ● | A red icon indicates the total number of Recalls, TSBs, and OEM Campaigns that have been found. |
| ● | A green icon indicates a search was performed and no results were found. |
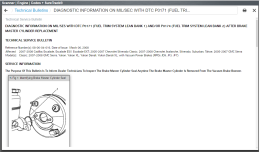
Selecting the Technical Bulletins card provides a detailed list view of the available OEM Recalls, TSBs, and Campaigns .
Select a topic from the list to view detailed information on the topic.
Select the Print icon to print the topic See Printing / Printer Setup.
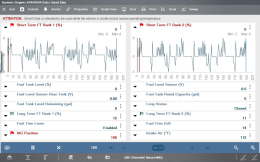
Smart Data filters out all non-relevant PIDs and shows you a custom list of PIDs only related to the selected code. In addition, specific PIDs in the list are prearmed using known-good upper and lower trigger values.
Smart Data works best when the vehicle is idling at operating temperature with no load present. Always refer to OEM service information for specific PID range limit information.
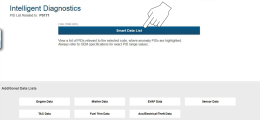
Selecting the Smart Data card opens the Smart Data main menu, which includes additional data list options (bottom of screen).
Selecting the Smart Data List opens the custom code-specific PID list.
About Prearmed Smart Data PIDs
About Prearmed Smart Data PIDs
Features and operation of prearmed Smart Data PIDs:
| ● | Any PID with a flag displayed has been preset and prearmed. |
| – | A red flag indicates the PID is operating out of range and the trigger has been activated. |
| – | A blue outlined flag indicates the PID is armed, and operating within it’s limits (trigger not activated). |
| ● | PID trigger points (upper/lower value limits) are automatically set using known-good upper/lower limit values. |
| – | Note - Upper/lower limit lines are not displayed on the graph, and values are not displayed in settings. |
| ● | A PID trigger is activated when the PID value exceeds the upper/lower trigger point. |
| ● | After a PID trigger has been activated a red cursor is placed on the graph and a short data movie is automatically saved. |
| ● | Smart Data PID triggers can be (overridden) set manually |
| – | Note - Manually setting trigger values will override the preconfigured Smart Data values. |
| – | Note - Manually set triggers will display upper and lower trigger limit lines in the graph. |
Functional Tests and Reset Procedures
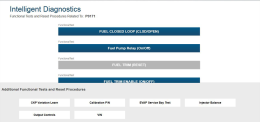
Selecting the Functional Tests and Reset Procedures card opens the Tests main menu which displays a list of bi-directional tests and procedures related to troubleshooting the selected codes. Functional tests and reset procedures allow you to manually control certain component operations (e.g. turn fuel pump on/off) and reset certain control module values (e.g. reset fuel trim) directly from the diagnostic tool to confirm the operation of components and validate repairs.
Intelligent Diagnostics Functional Tests and Reset Procedures operation and navigation is similar to the Functional Tests within the Scanner function. For additional information see Functional Tests.
Additional Functional Tests and Reset options may be displayed at the bottom of the screen, depending on the vehicle. These options are not DTC related, but are vehicle specific related, and may be useful in troubleshooting or validating repairs.
Guided Component Tests (GCTs)
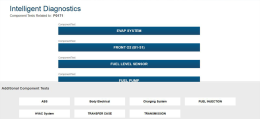
Selecting the Guided Component Tests card opens the Components Tests main menu , which displays a menu list of tests related to the troubleshooting of the selected codes.
Intelligent Diagnostics Guided Component Tests operation and navigation is similar to the main Guided Component Tests function accessed from the Home screen. For additional information see Guided Component Tests.
Additional Component Tests may be displayed at the bottom of the screen depending on the vehicle. These options are not DTC related, but are vehicle specific related, and may be useful in troubleshooting or validating repairs.
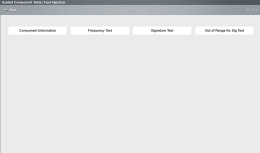
After a test is selected a component test sub-menu opens. The component test sub-menu may include various test options and a Component Information selection if supported.
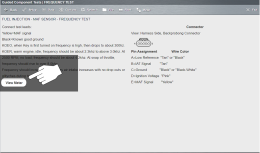
Guided Component Tests are tests with step-by-step instructions to guide you through the process of performing component tests. They may include specifications, tips, and directions on how and where to connect the test meter leads. Some tests may also automatically configure the multimeter or lab scope to perform the selected test.
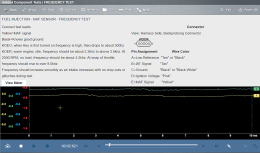
Selecting the View Meter icon opens the meter/scope display and allows you to review the guided instructions and monitor the signal simultaneously.
For GCT upper toolbar control icon descriptions, see Main Screen and Toolbars.
For Scope/Meter toolbar control descriptions, see Control Panel and Settings.
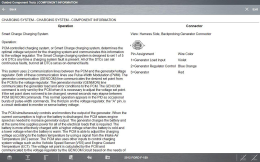
Selecting Component Information (if available) provides details on specific vehicle components to provide a better understanding of the components prior to diagnosis. The Component Information screens contain information to assist you with testing. The screens are divided in sections to help quickly guide you to the correct information.
| ● | Operation—provides a general description of normal component operation. |
| ● | Connector—displays the component connector and lists pin assignments. |
| ● | Location—identifies the component location and the best place for testing it. |
| ● | Tech note—provides Guided Component Test‑related tips (for example, common failures or faults) as well as update or recall information. |
Real Fixes
Troubleshooter
Repair Information

