Basic Features / Controls / Navigation
The ShopStream Diagnostic Suite program is used for all diagnostic functions. The ShopStream Diagnostic Suite icon ![]() is located on the Windows desktop.
is located on the Windows desktop.
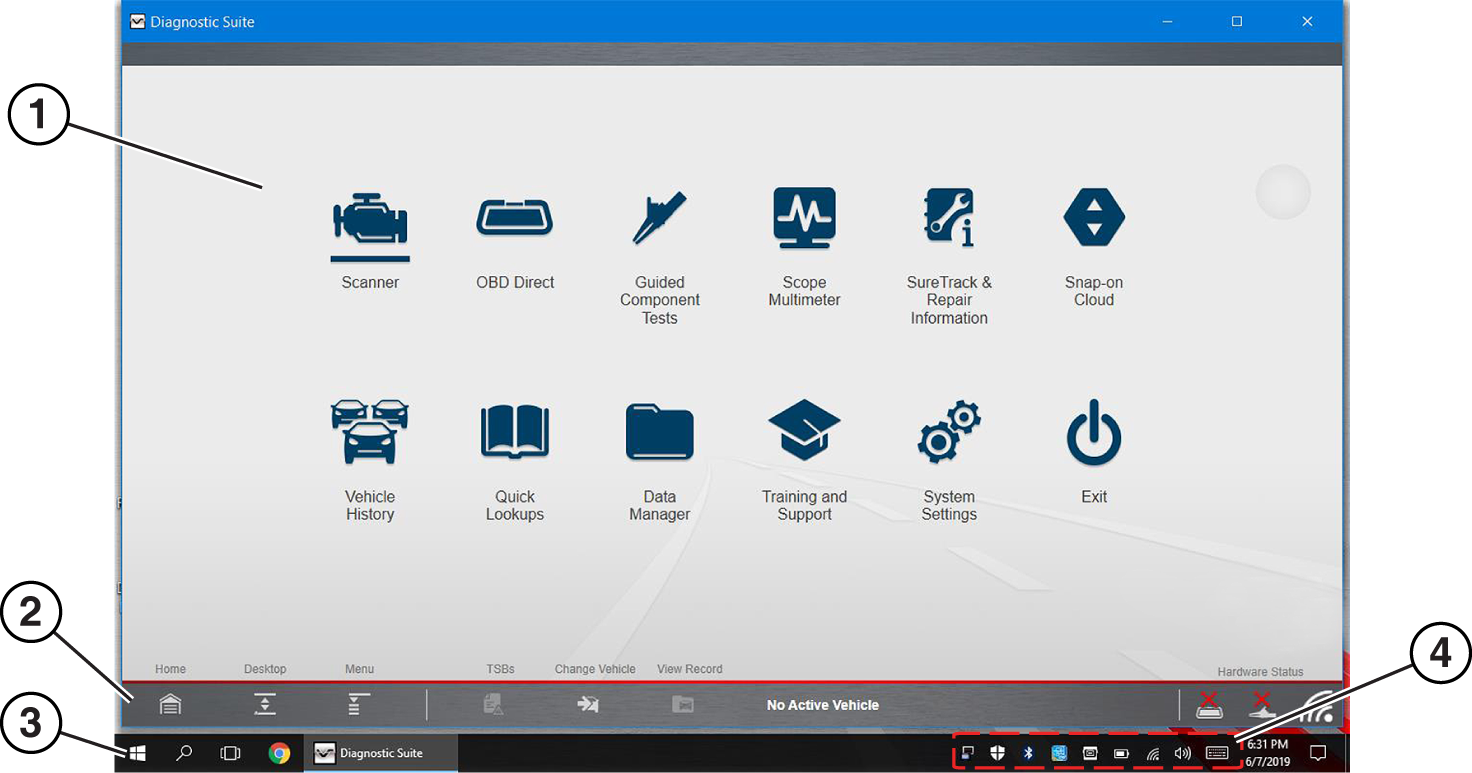
The program is automatically started when the diagnostic tool is turned on through the Windows “start up” folder function. Once started the Home Screen displays, see Home Screen Layout. The program runs in a normal window and can be minimized, resized, and closed like any other Windows program.
To access the Windows desktop, minimize the program window, or use the Desktop icon, see Toolbar Icons
The ShopStream Diagnostic Suite can also be started from the Windows Start menu.
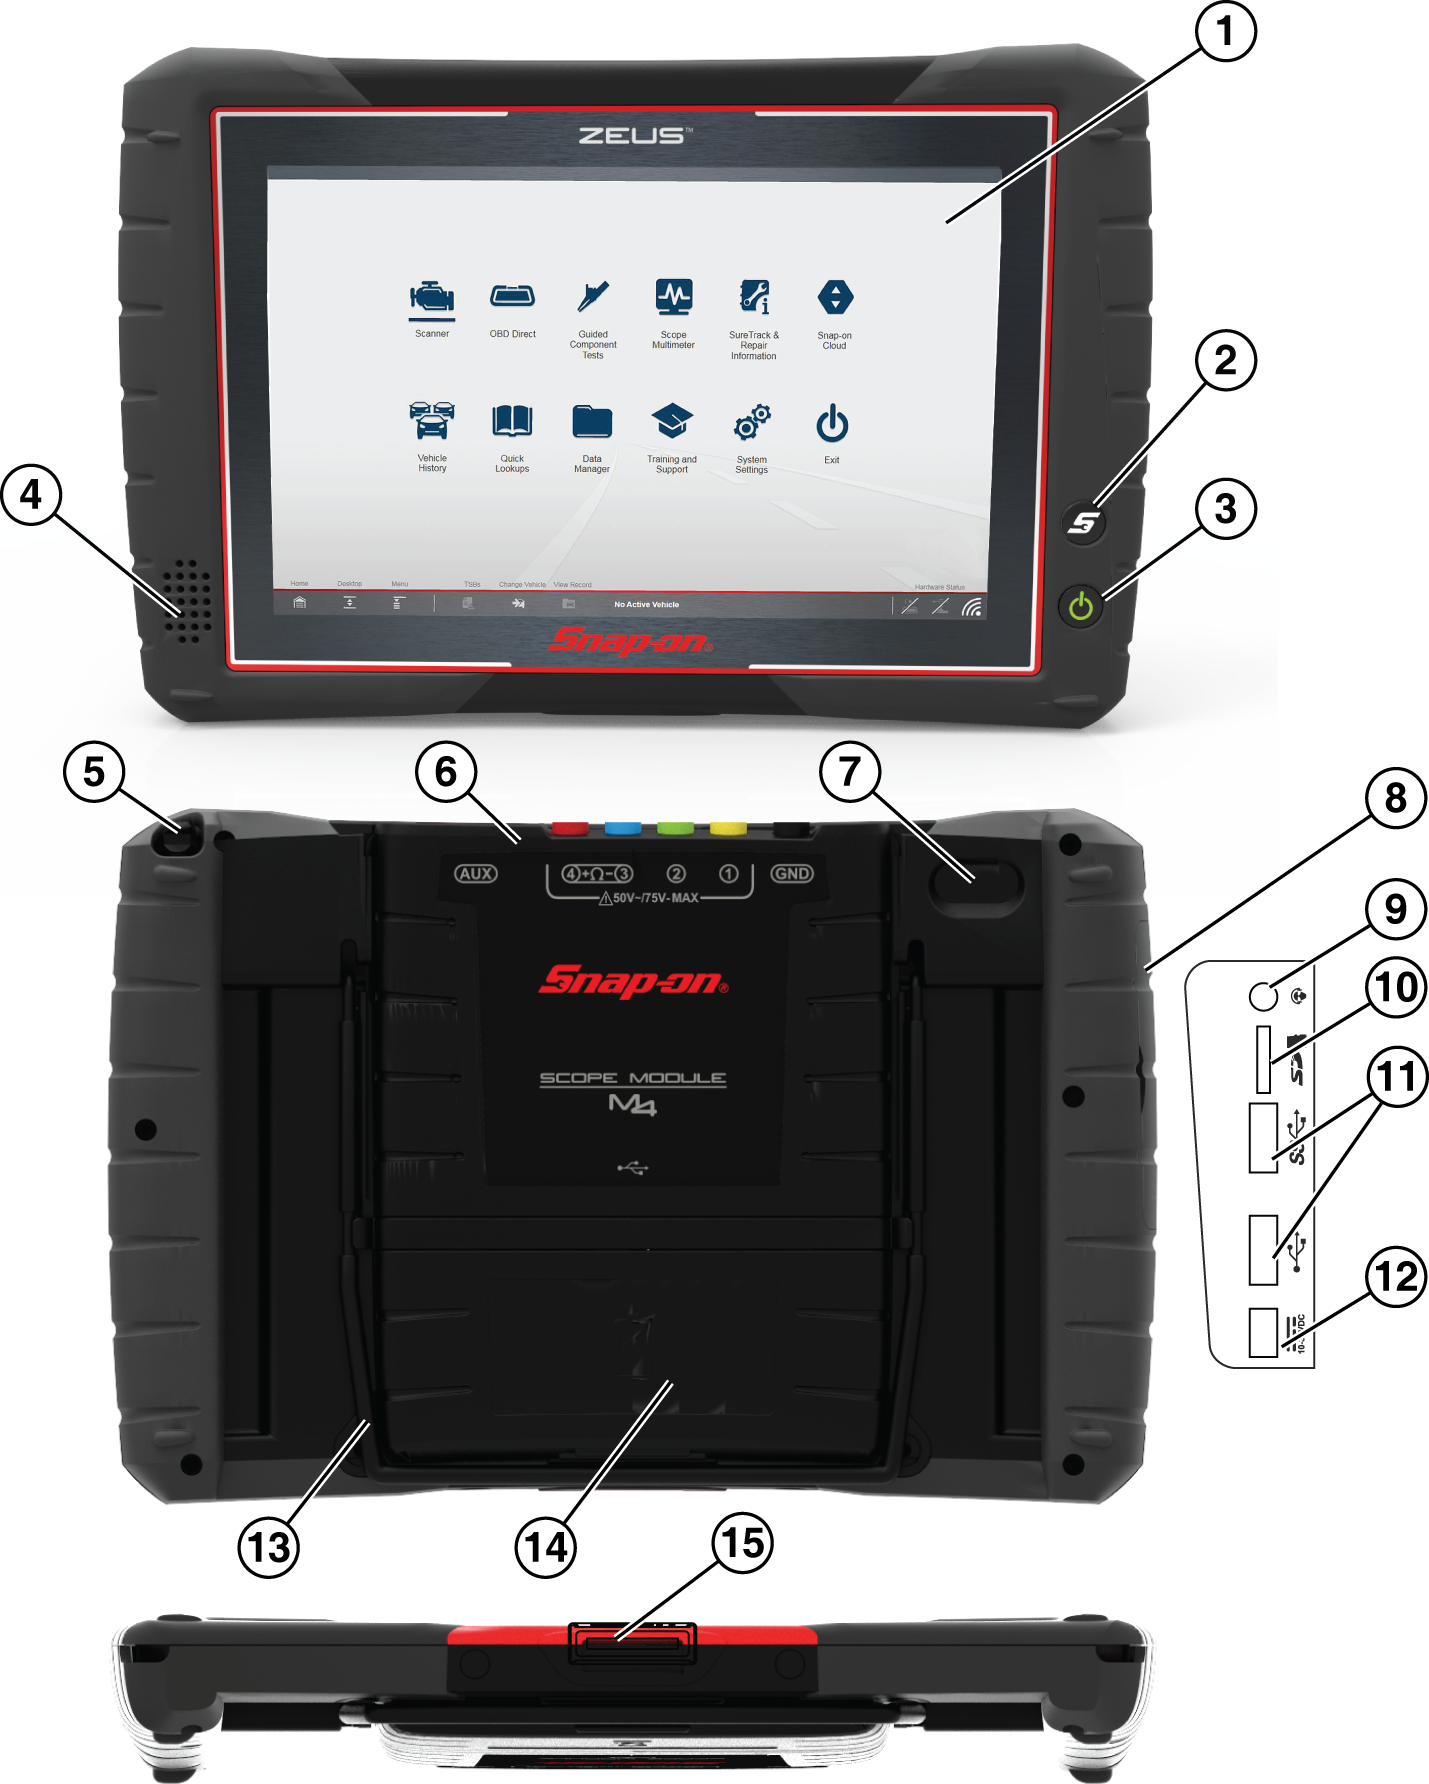
| 1. | Capacitive Touch Screen |
| 2. | Shortcut (S) Button (special functions) |
| 3. | Power Button (with backlit LED functions) |
| 4. | Audio Speaker |
| 5. | Stylus Storage |
| 6. | Scope Module M4 (removable) |
| 7. | Camera Lens |
| 8. | Communication and Power Jacks Cover |
| 9. | Head Phone Jack |
| 10. | Micro SD Card Slot |
| 11. | USB (universal serial bus) Jacks (2) |
| 12. | DC Power Supply Input Jack |
| 13. | Collapsible Stand |
| 14. | Battery Pack |
| 15. | Docking Station Connector |
The Home Screen Icons configure the diagnostic tool for the type of test to be performed. The following table gives brief descriptions of the available icons, which operations are available depends upon the individual configuration of your system. Use the stylus or your finger tip to select from the icons.
|
Icon |
Description |
|
Scanner |
Configures the diagnostic tool to operate as a scan tool. |
|
|
|
|
OBD Direct |
Allows you to perform generic OBD-II or EOBD system tests without identifying the specific vehicle. |
|
|
|
|
Guided Component Test |
Opens a diagnostic database of specific tests for the identified vehicle. |
|
|
|
|
Scope Multimeter |
Configures the diagnostic tool to operate as a lab scope, graphing multimeter, or digital multimeter. |
|
|
|
|
SureTrack & Repair Information |
Once configured, opens SureTrack, ShopKey Pro or Pro Demand depending on your account authorization. |
|
|
|
|
Snap-on Cloud |
Opens the Snap-on Cloud website. |
|
|
|
|
Vehicle History |
Identifies the test vehicle and organizes and manages work in progress and service records. |
|
|
|
|
Quick Lookups |
Provides OEM vehicle information for Oil Specs and Resets and Technical Service Bulletins. |
|
|
|
|
Data Manager |
Opens the organization system for saved data files. |
|
|
|
|
Training and Support |
Opens the Snap-on Diagnostics website. From the website you can view training videos or download the diagnostic tool user manual and other product support documentation. |
|
|
|
|
System Settings |
Establishes and manages connections to peripheral devices, such as the Scan Module. |
|
|
|
|
Exit |
|
|
|
Closes the diagnostic tool software and returns the display to the Windows desktop. |
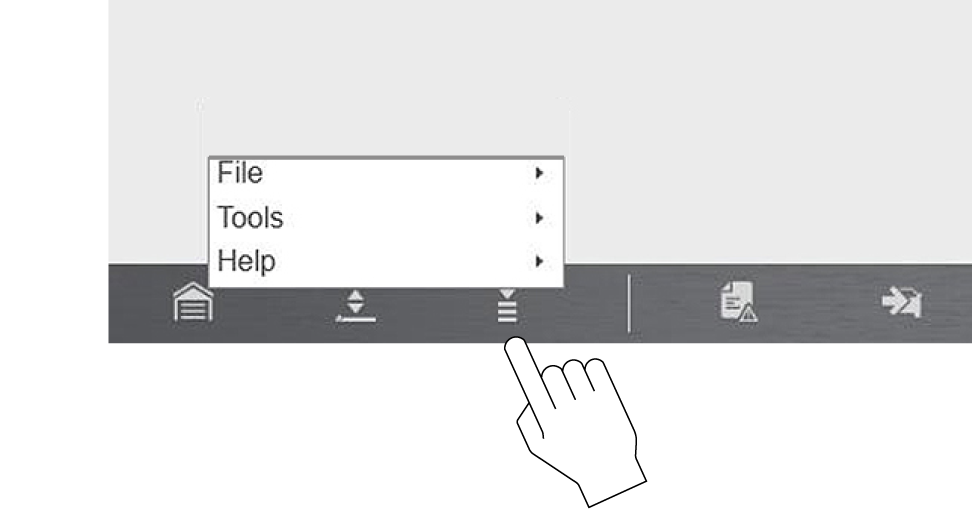
The Menu icon ![]() on the Toolbar at the base of the display screen provides various system information. Menu choices are applicable to the active screen or function.
on the Toolbar at the base of the display screen provides various system information. Menu choices are applicable to the active screen or function.
The HELP option is available from all screens. The menu choices will vary, however HELP always includes:
| ● | Version Info - Displays the software version information. |
| ● | Activation Status - Displays the software licensing details for the system, and activation status for the diagnostic tool and all other modules. |
Operation of the icons located on the toolbar are described in the table below:
|
Icon |
Description |
|
Home |
Selecting this icon returns you to the Home screen from any test. |
|
|
|
|
Desktop |
Selecting this icon toggles the Windows taskbar on/off at the bottom of the screen, and allows you access to the Windows desktop. |
|
|
|
|
Menu |
Selecting this icon opens a menu that provides information and basic operations and features for the current screen. |
|
|
|
|
Technical Service Bulletins |
Provides Technical Service Bulletin information (if available) for the identified vehicle. |
|
|
|
|
Change Vehicle |
The currently identified vehicle is shown to the right of the icons, selecting allows you to change the identified test vehicle. |
|
|
|
|
View Record |
Selecting the icon opens an editable worksheet of vehicle records. |
|
|
|
|
DLC Voltage |
When the compact scan module is connected to a vehicle the vehicle’s OBD-II data link connector (DLC) voltage is displayed. |
|
|
|
|
Compact Scan Module Hardware Status |
Indicates the connectivity status of the Compact Scan Module. Icon changes depending on status. |
|
|
|
|
Scope Module Hardware Status |
Indicates the connectivity status of the Scope Multimeter Module. Icon changes depending on status. |
|
|
|
|
Wi-Fi Icon |
Indicates the connectivity status of your Wi-Fi connection. |
|
|
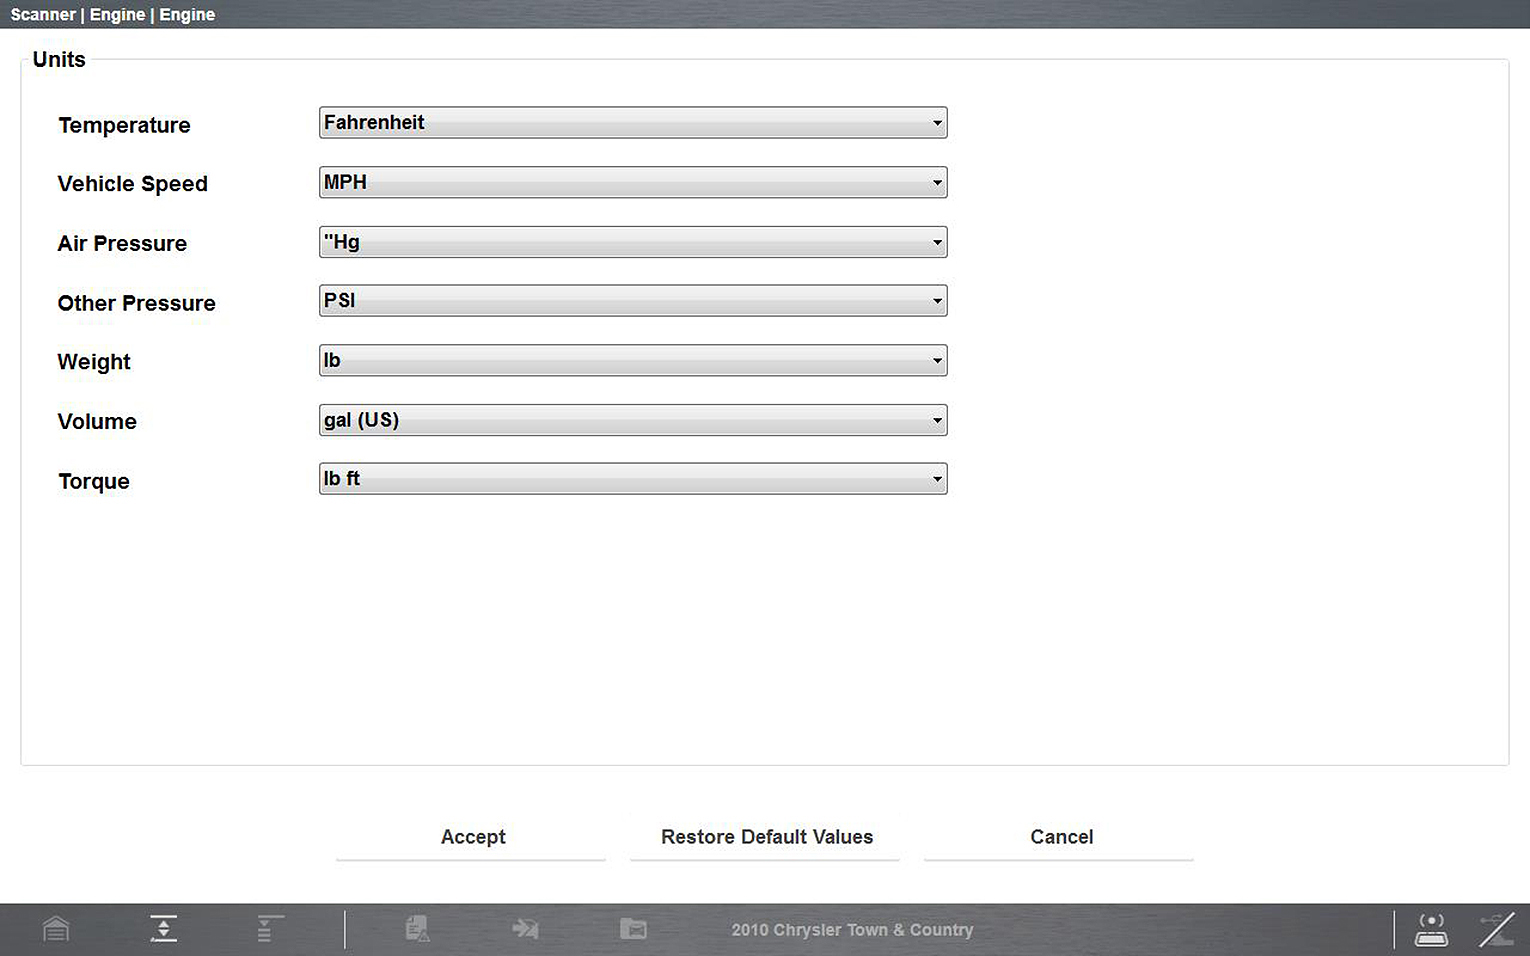
The Diagnostic Suite units of measurement can be changed for temperature, vehicle speed, air pressure and other pressure readings. Choose between US customary or metric units of measure.
| 1. | Select Scanner.. |
| 2. | Select the Menu icon from the lower toolbar. |
| 3. | Select Tools > Units Setup.. |
The Units setup dialog box opens.
| 4. | Use the dropdown menus to select the desired value for each item. |
| 5. | Select Accept to close the dialog box and apply the changes. |


