Cursors
Cursors  are only available in Lab Scope and Graphing Multimeter functions.
Two vertical cursors are provided that allow you to make precise signal measurements. This is most useful when determining signal characteristics such as amplitude at specific points, and cycle time (duration) or frequency.
Using cursors can also be helpful when performing diagnostic tests, such as:
|
●
|
O2 sensor rich/lean switch time |
|
●
|
fuel injector pulse width frequency |
|
●
|
secondary ignition spark duration |
|
●
|
crankshaft position sensor frequency |
Measurements can quickly be taken between the two cursors, when measuring a single cycle or across multiple cycles by positioning the cursors at the start and end of the cycle or multiple cycles. Cursor measurements are displayed in the Control Panel when using the cursors, providing you digital values of the cursor measurements.
To Turn the Cursors On/Off
|
1.
|
Select Cursors (upper toolbar to open the Cursors dialog box. |
|
2.
|
To turn the Cursors on/off, select Show or Hide icon as applicable. |
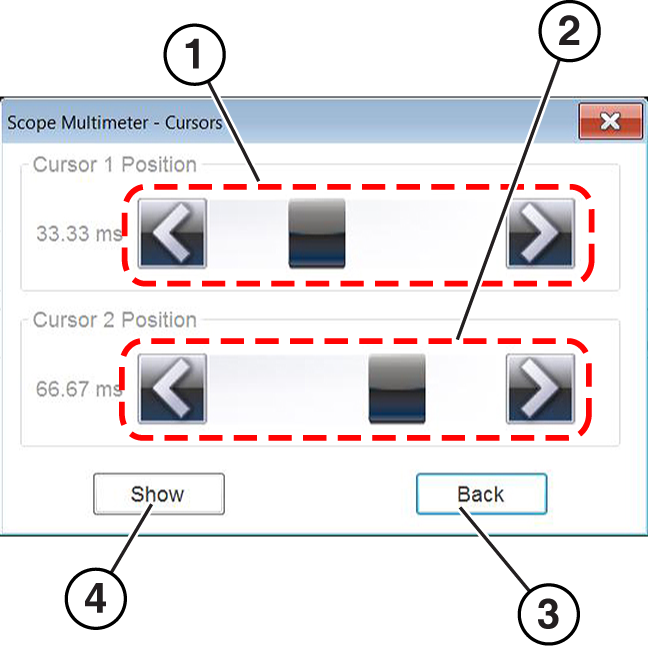
To Position the Cursors
The cursors can be positioned anywhere within the range of the sweep scale by either dragging them horizontally on the graph, or using the cursors control menu.
|
●
|
Control Menu - select Cursors from the upper toolbar, then drag the applicable slider or select the arrows to position the cursors. Each tap of the stylus moves the cursor incrementally in the direction of the arrows. |
|
●
|
Onscreen - select either cursor marker (base) and drag it to the desired position. |
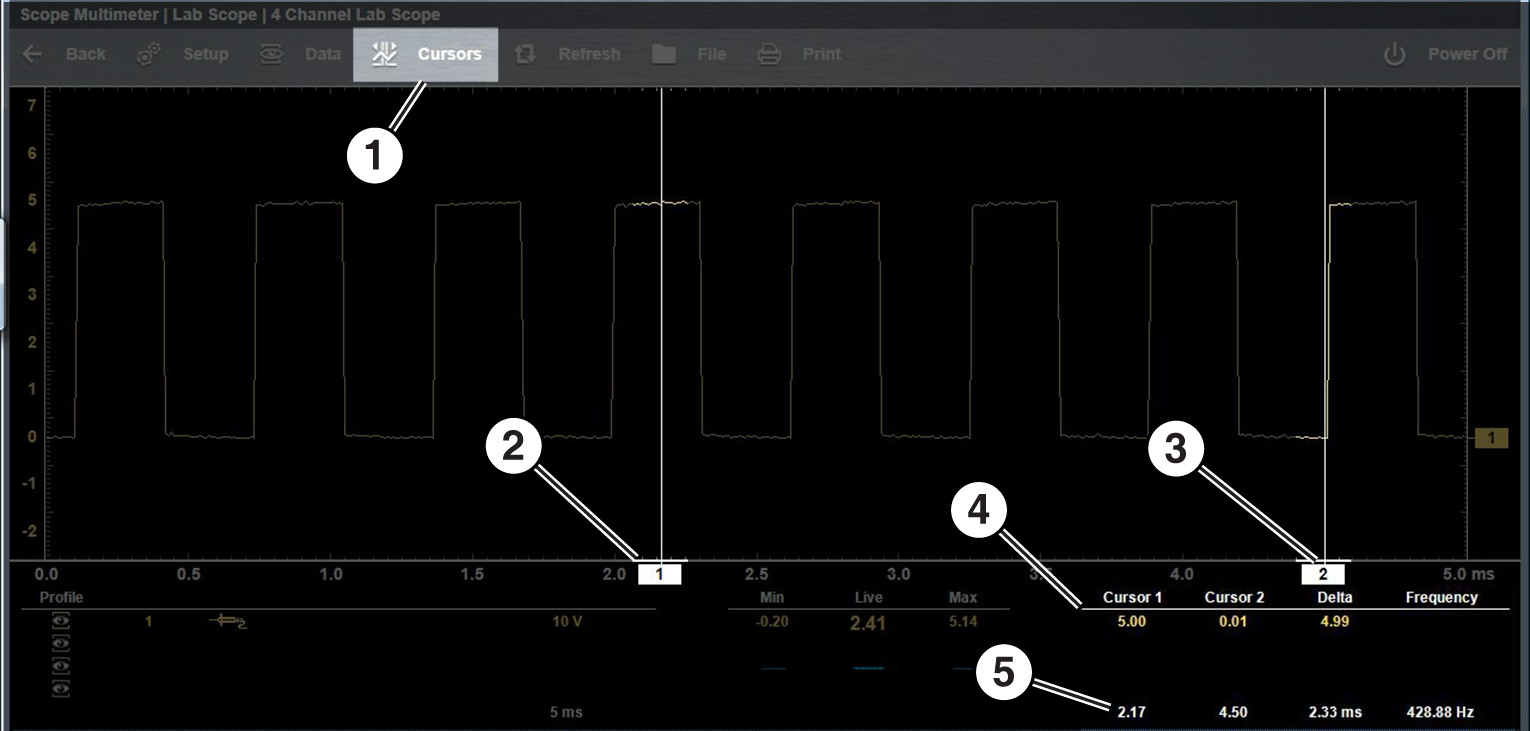
Cursor Measurements Panel
When the cursors are turned on, the cursor measurements panel can display the following signal and cursor measurements:
|
●
|
Signal amplitude at two points |
|
●
|
Signal amplitude difference (delta) between two points |
|
●
|
Cursor position in time at two points |
|
●
|
Difference (delta) in time between the cursors |
|
●
|
Frequency - frequency of the signal for the time period between cursor 1 and 2 |
The cursor measurements panel contains values for each channel in two displays.
The time and delta display is gray in color and includes (shown when collecting data):
|
–
|
Cursor 1 - cursor position in time at cursor 1 |
|
–
|
Cursor 2 - cursor position in time at cursor 2 |
|
–
|
Delta - difference in time between cursor 1 and 2 |
|
–
|
Frequency - the frequency value (Hz) of the signal for the time period between cursor 1 and 2 |
The amplitude and delta display is shown in the channel specific color and includes (shown when data is paused):
|
–
|
Cursor 1 - signal amplitude at cursor 1 position |
|
–
|
Cursor 2 - signal amplitude at cursor 2 position |
|
–
|
Delta - signal amplitude difference between cursor 1 and 2 |
Frequency is the number of times a signal repeats itself per second and is measured in hertz (Hz).
The frequency value displayed, is the inverse of the Delta value, and can also be calculated as 1 divided by Delta. The frequency value (Hz) shown is automatically calculated by the scope.
Example 1: Delta = 20.46ms, to get frequency divide 1 by .02046 (1/.02046 = 48.87Hz)
Example 2: Delta = 2.53ms, to get frequency divide 1 by .00253 (1/.00253 = 395.27Hz)
Use applicable decimal point placement during division as the Delta value changes.