Fast-Track® Intelligent Diagnostics
 Wi-Fi is Required to Use This Application ! See Wi-Fi Connection*
Fast-Track Intelligent Diagnostics saves you time by providing access to code related data, information, and tests, all from one screen. It allows you to quickly find TSB's, smart data PID lists, out-of-range PIDs, functional tests, Sure Track Top Repairs Graph and Real Fixes, and more all at a glance.
In addition, you can directly access all (not just code related) PIDs and functional tests from one place, as compared to accessing them separately through the individual system menus.
Watch the TRITON-D10 Fast-Track Intelligent Diagnostics training video. Opens in a new tab.
To access Intelligent Diagnostics, you must:
| ● | have authorized access. Contact your sales representative for information. |
| ● | have a Wi-Fi connection. For Wi-Fi setup and connection see, Wi-Fi Connection / Troubleshooting *. |
Home Screen: Scanner (Vehicle Identification) > (Vehicle System Menu) > (Vehicle System Main Menu) > (Codes Menu) > (Code Results) Diagnose Icon
Intelligent Diagnostics functions are contained in a common multi-card main menu. Card functions are described in the following sections.
Intelligent Diagnostics and Scanner share some common functions. Cross references are used in the following sections for the applicable common information.
The cloud icon indicates Wi-Fi connection status . This icon is also used to indicate Intelligent Diagnostics service expiration. The icon will change red in color and display “Expired” when your service has expired.
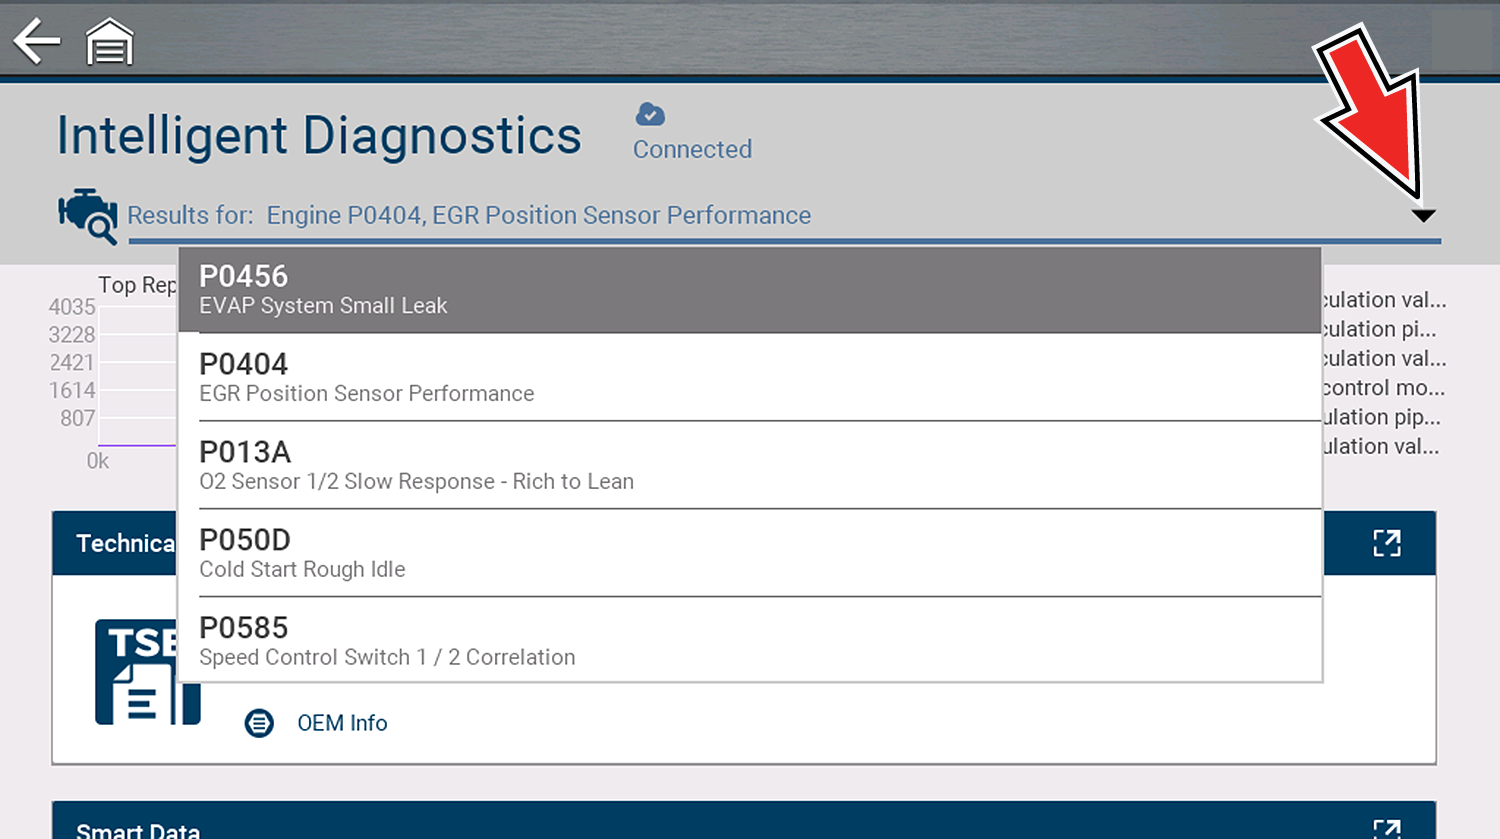
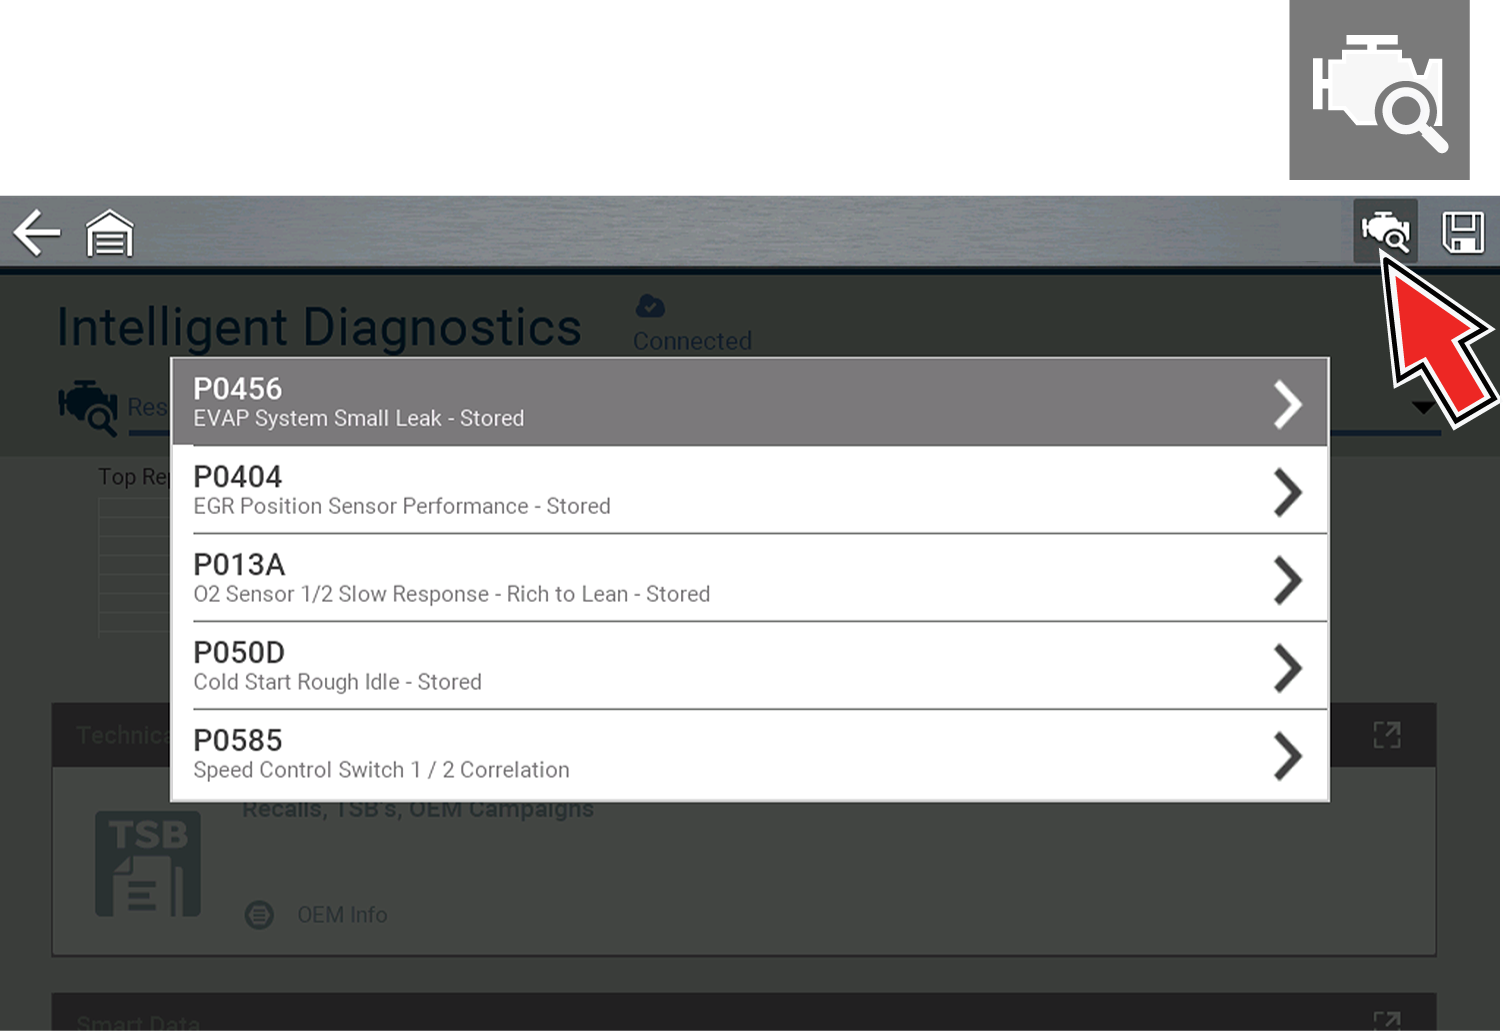
The Code Results Dropdown menu allows you to quickly choose any of the scanned codes from the code results list. Select a code to view related information about that code within Intelligent Diagnostics.

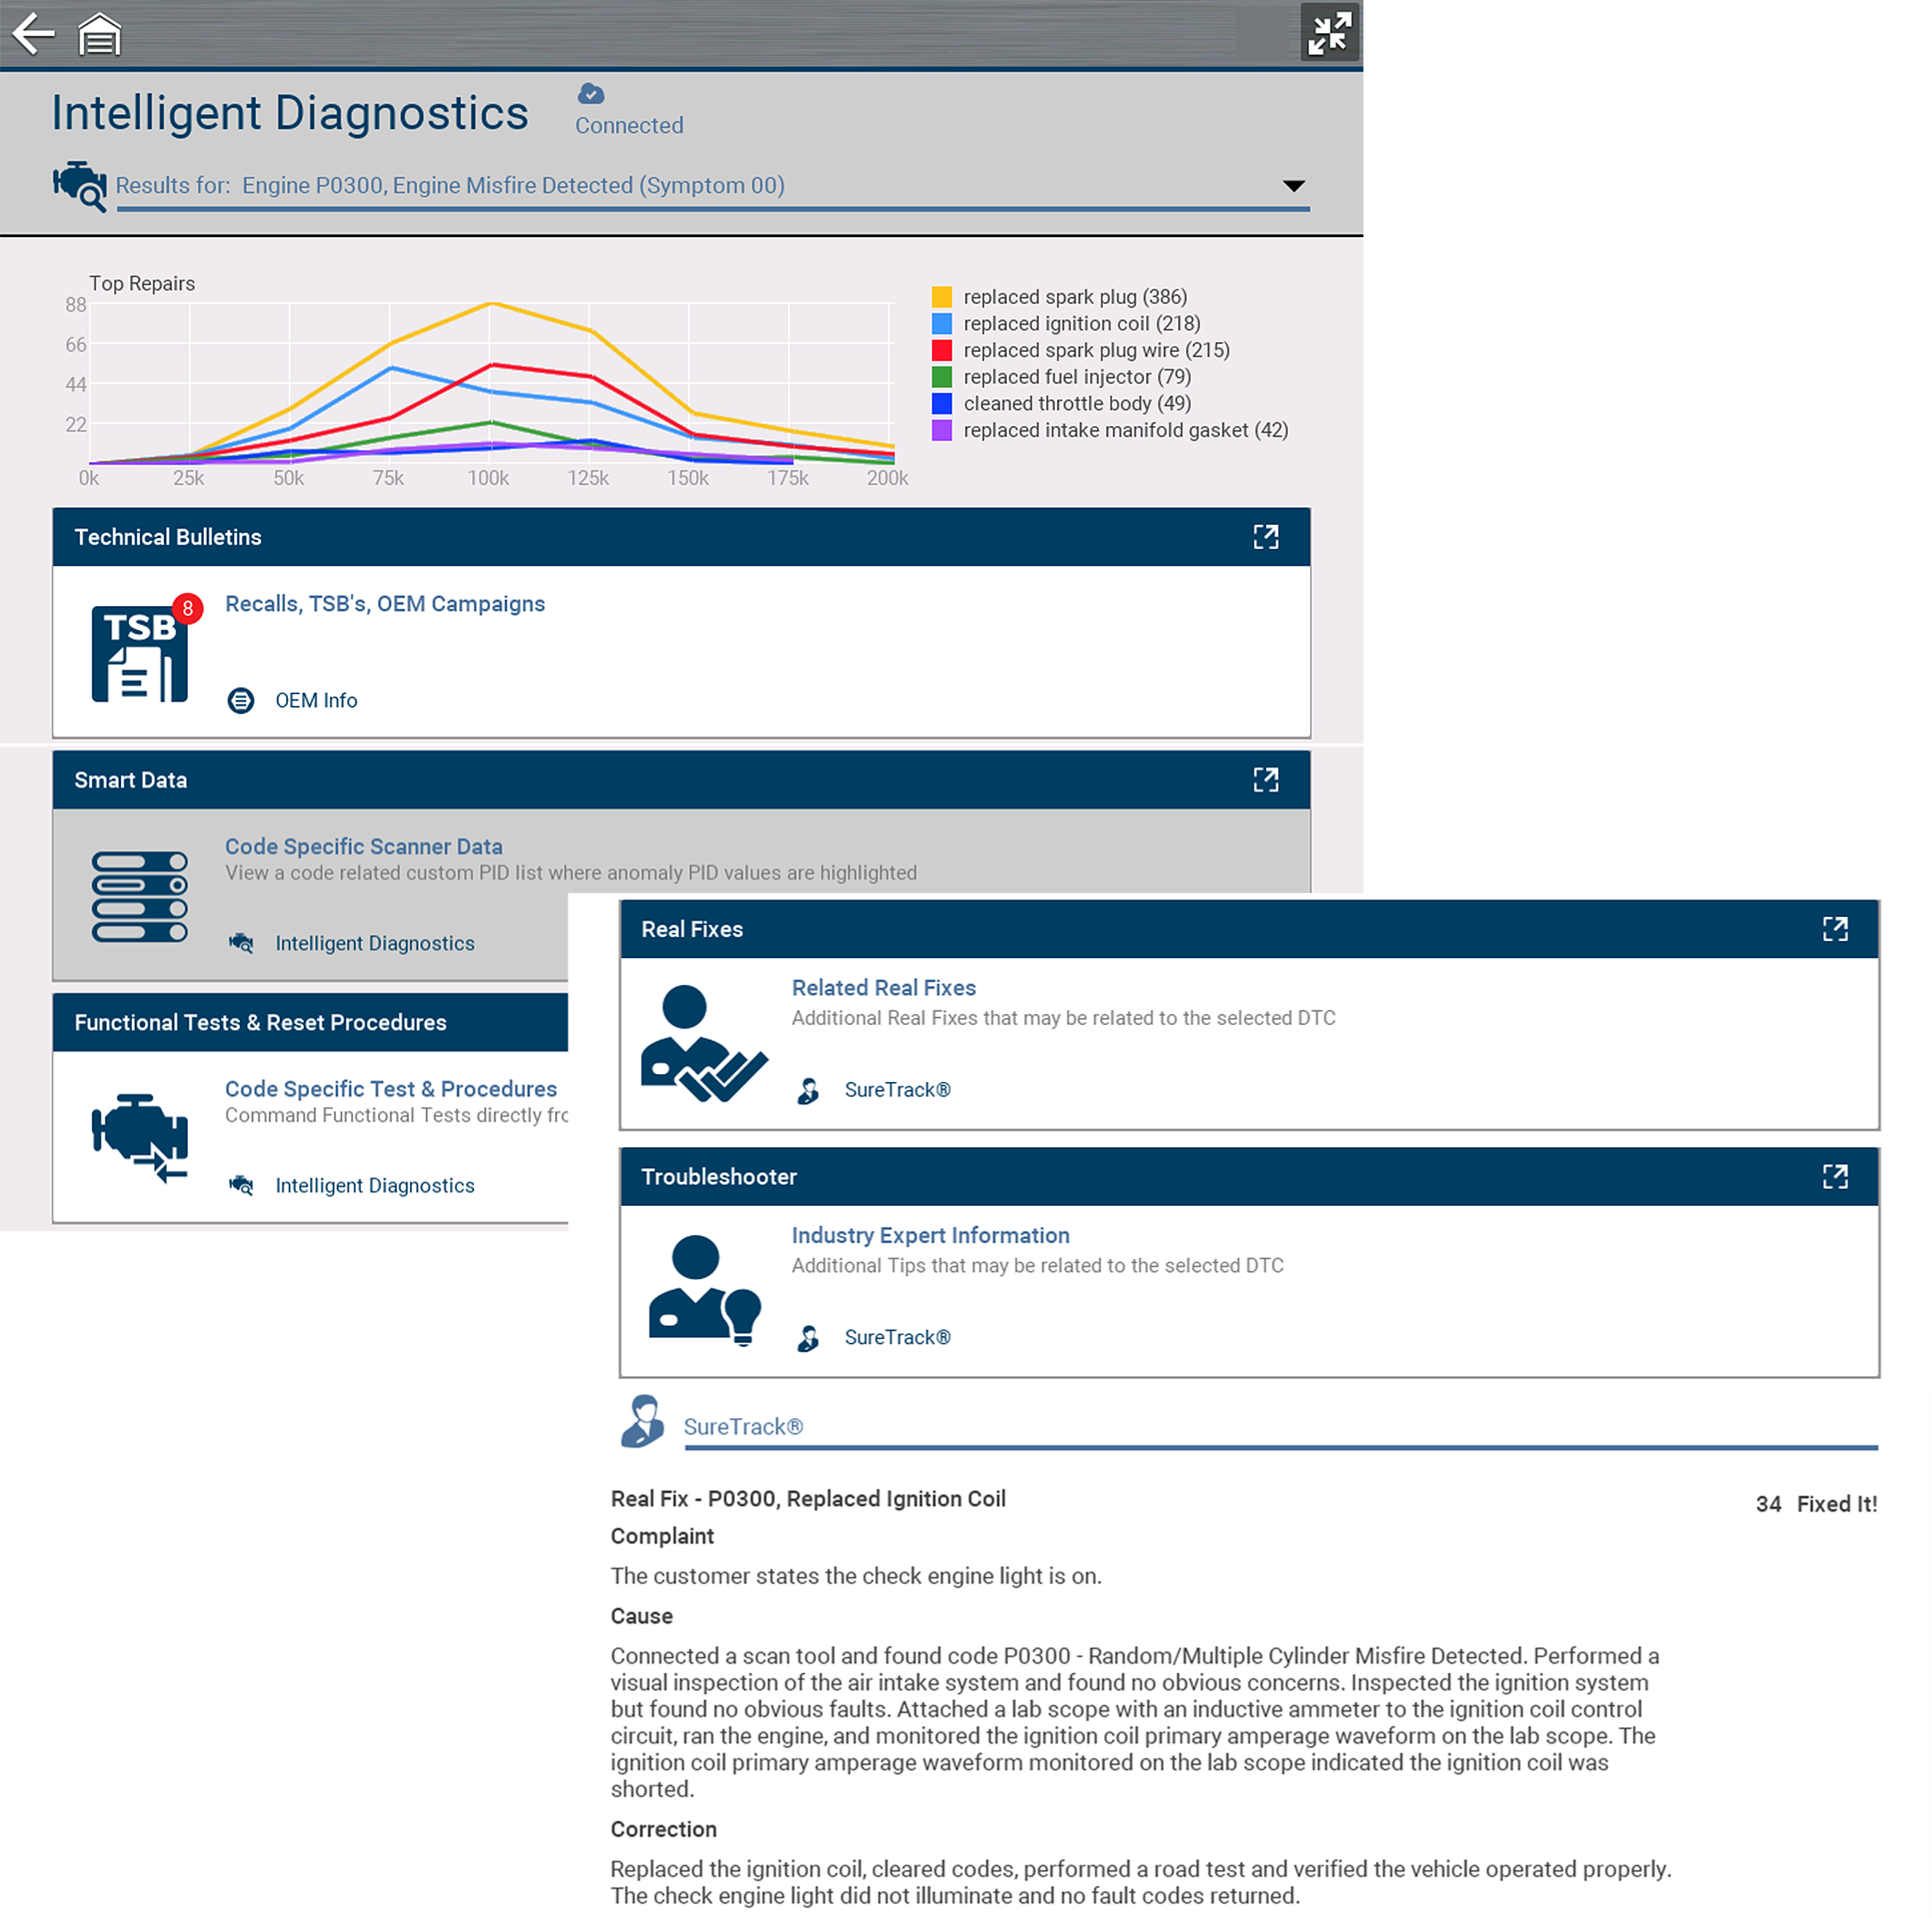
The Top Repairs Graph shows the most common verified fixes and procedures for the selected code.
Example - In the graph shown below, the most common fix for the code was replacing the intake manifold gasket. This fix occurred 413 times, with the most occurrences (85) at 100k miles in vehicles with up to 200k miles.
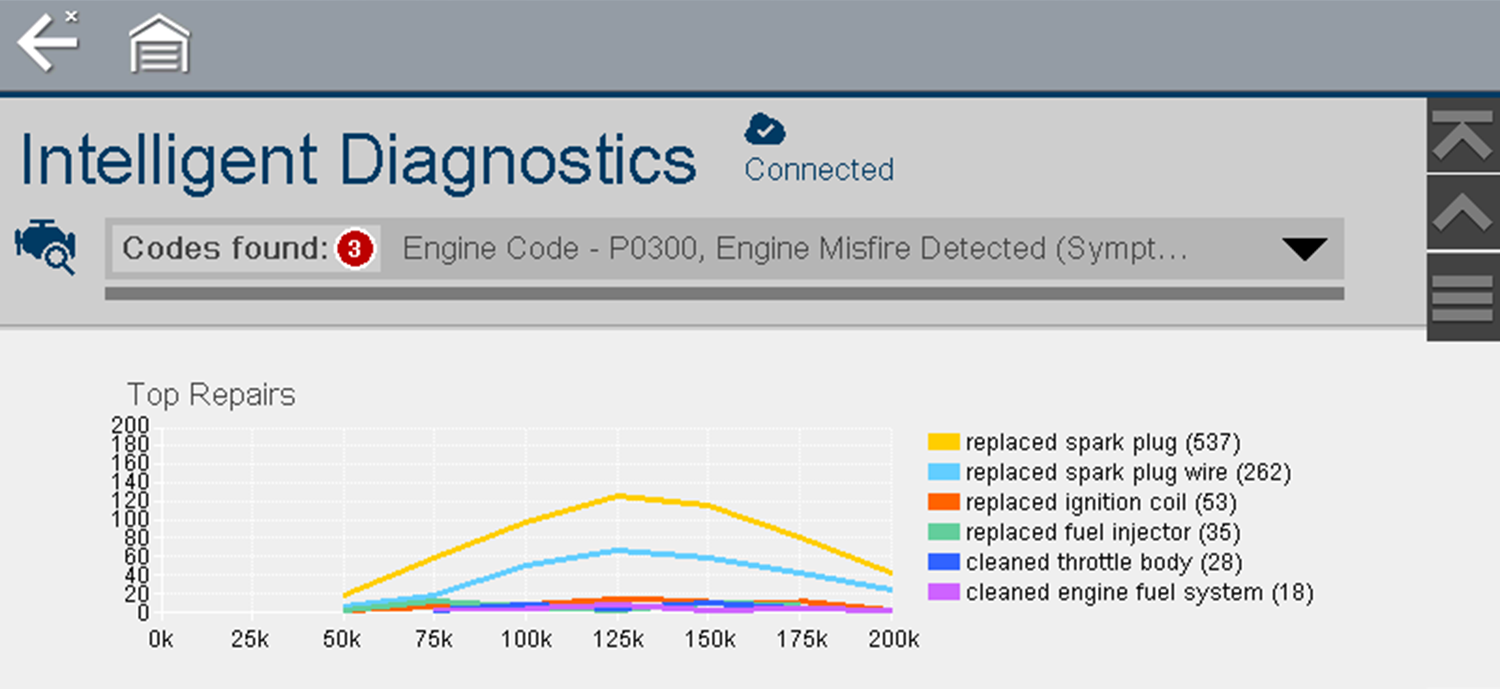
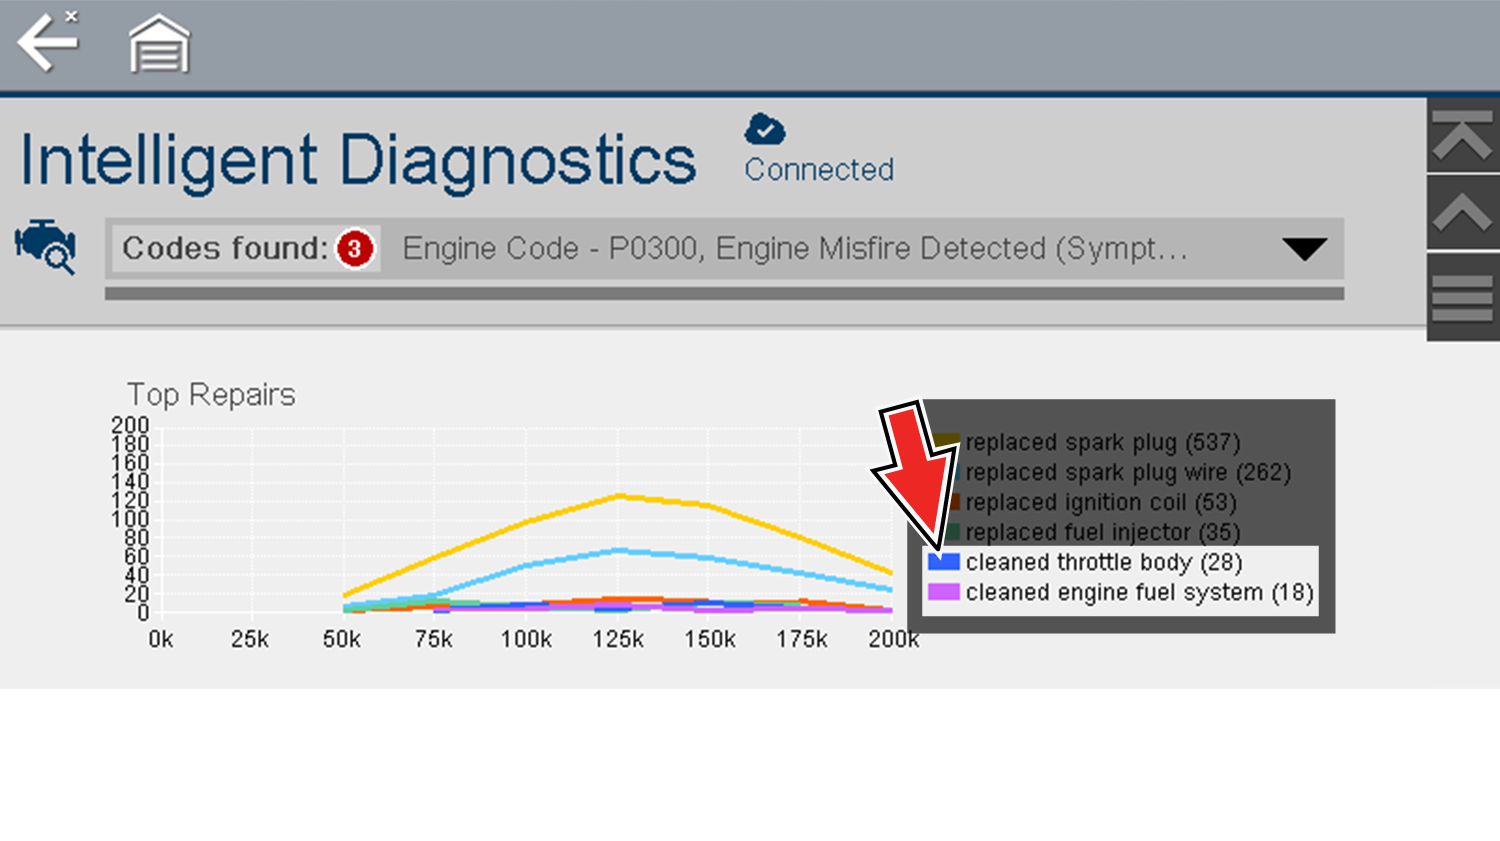
Depending on the information available, the graph may also include probable causes. See example to clean mass airflow sensor.
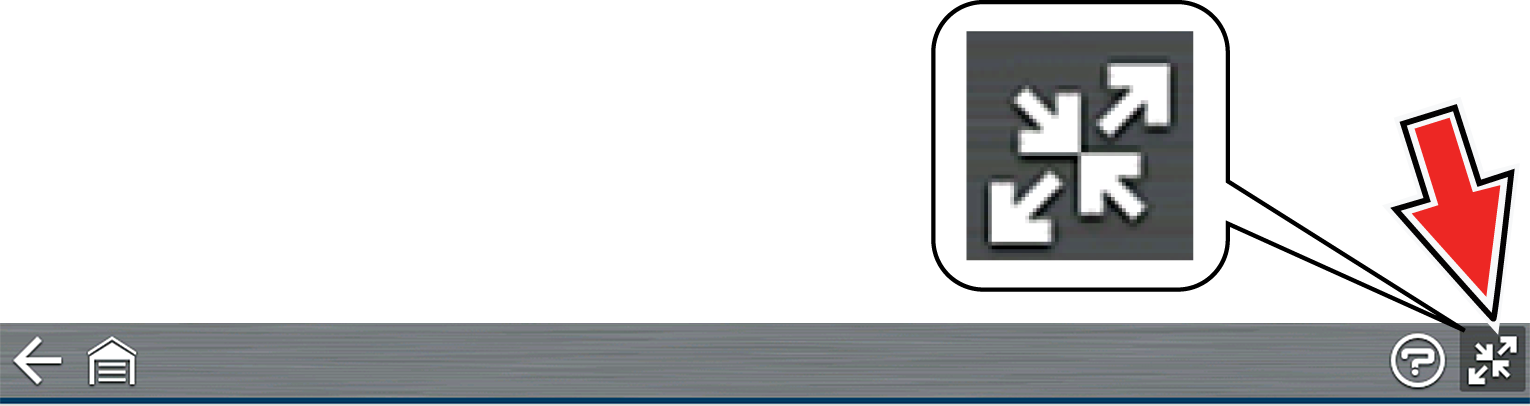
Select the Expand/Contract icon from the toolbar to change (toggle) the Top Repairs display mode.
The Technical Bulletins card provides a quick link to available OEM Recall, TSB and Campaign information that is code related.
| ● | A red icon indicates the total number of Recalls, TSBs, and OEM Campaigns that have been found. |
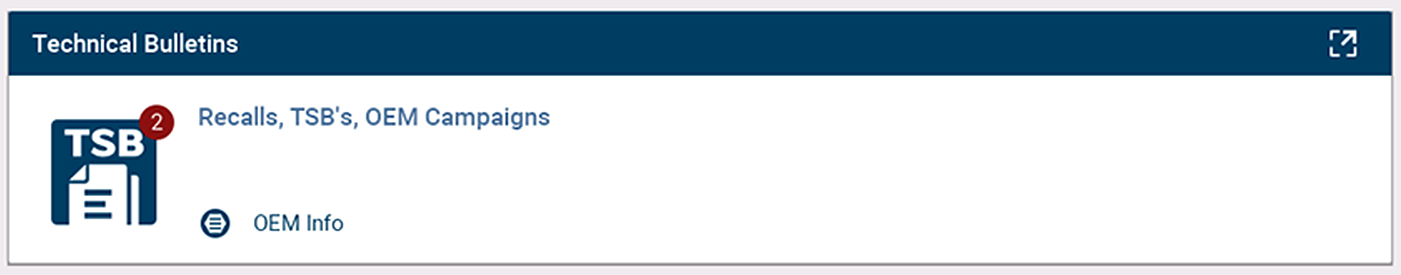
| ● | Green check mark indicates no TSS’s were found. |
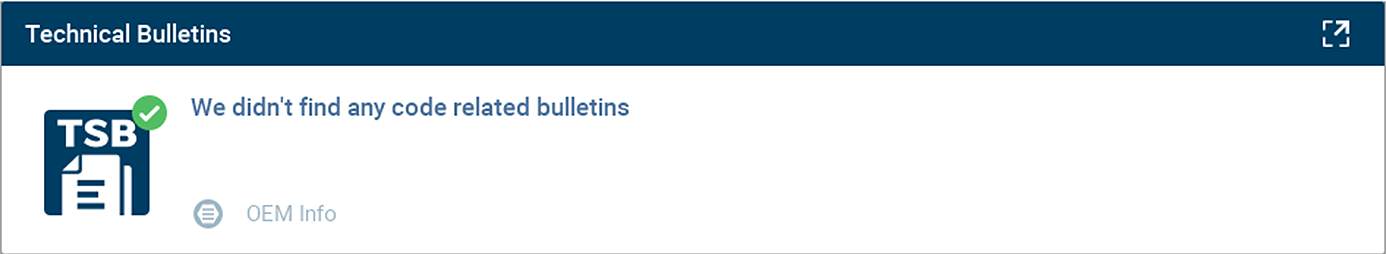
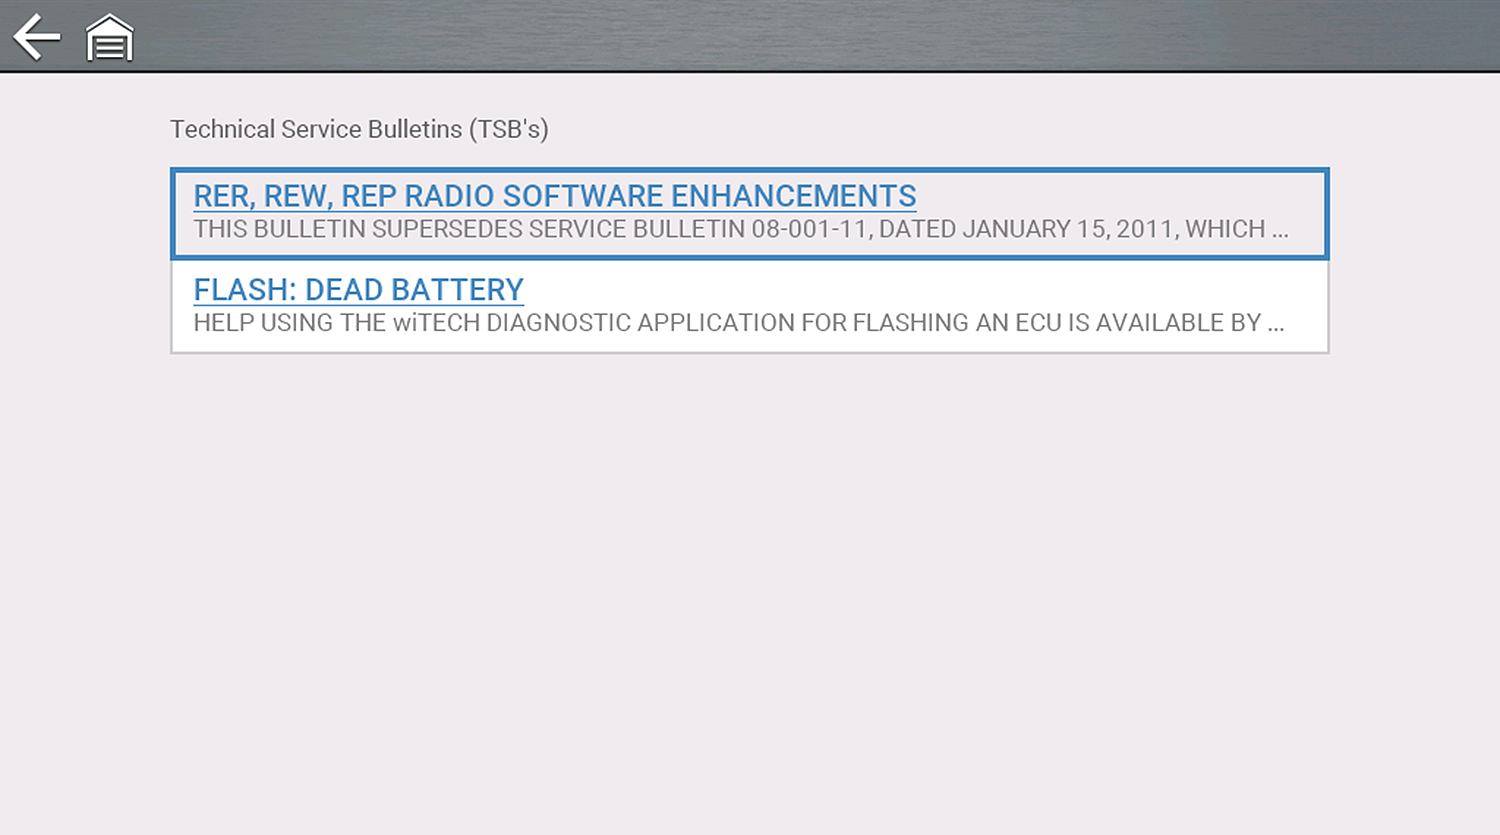
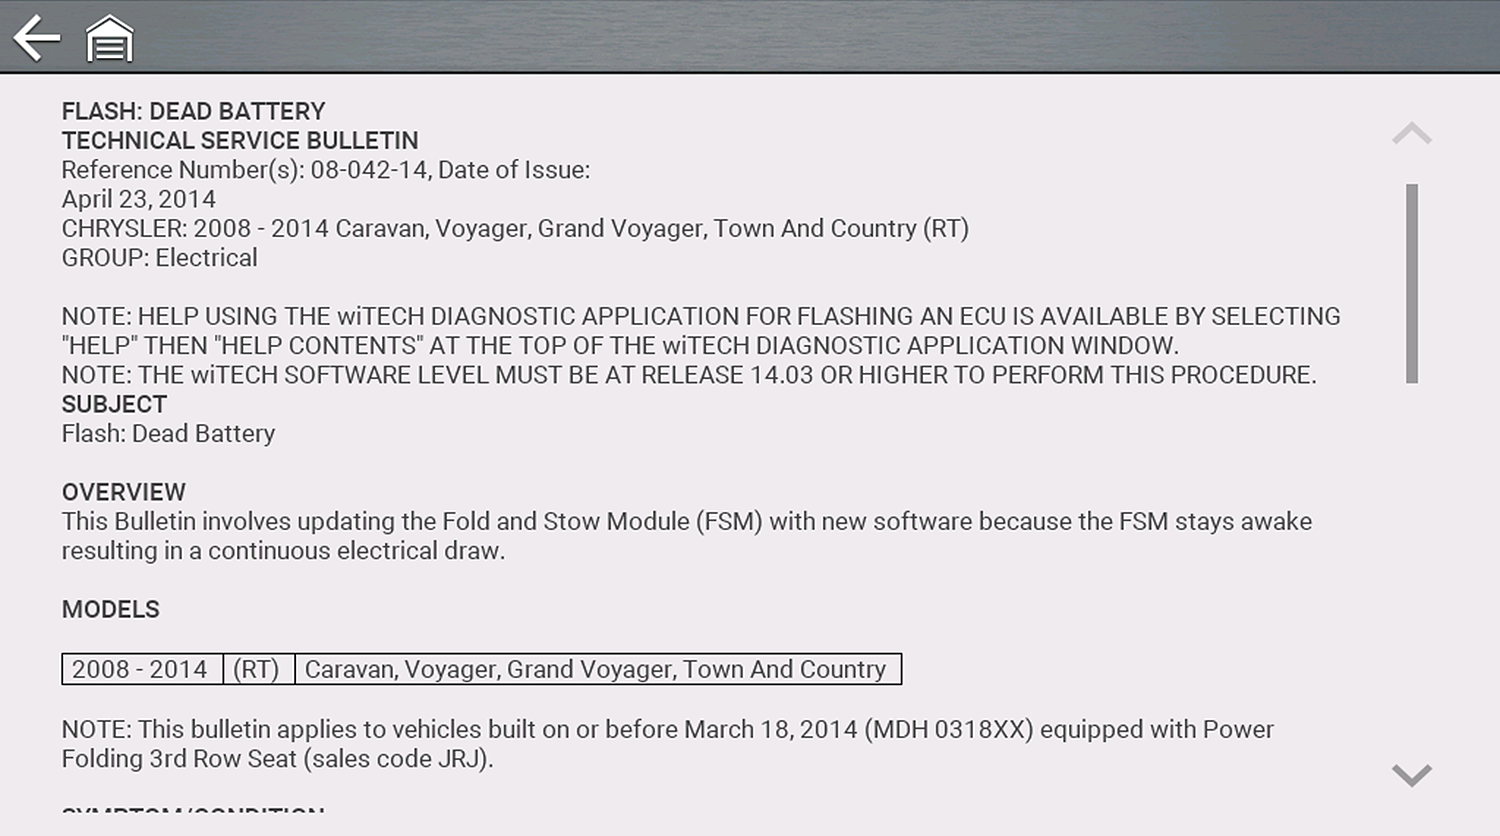
Select a topic from the list to view detailed information on the topic.
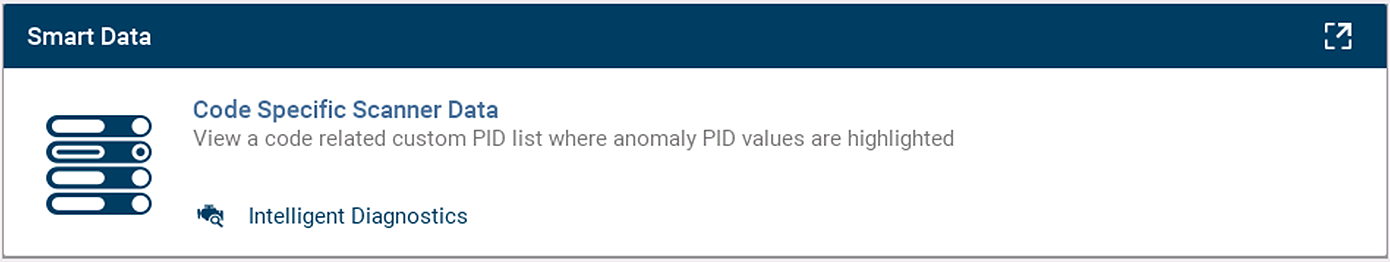
Smart Data automatically configures the data list to only show PIDs related to the selected code. Non-related PIDs are filtered out, to save you time. In addition, it highlights PIDs that are out of expected range.
As an added troubleshooting feature, you can also directly access all (not just code related) PIDs from one place, as compared to accessing them separately through the individual system menus.
Smart Data works best when the vehicle is idling at operating temperature with no load present. Always refer to OEM service information for specific PID range limit information.
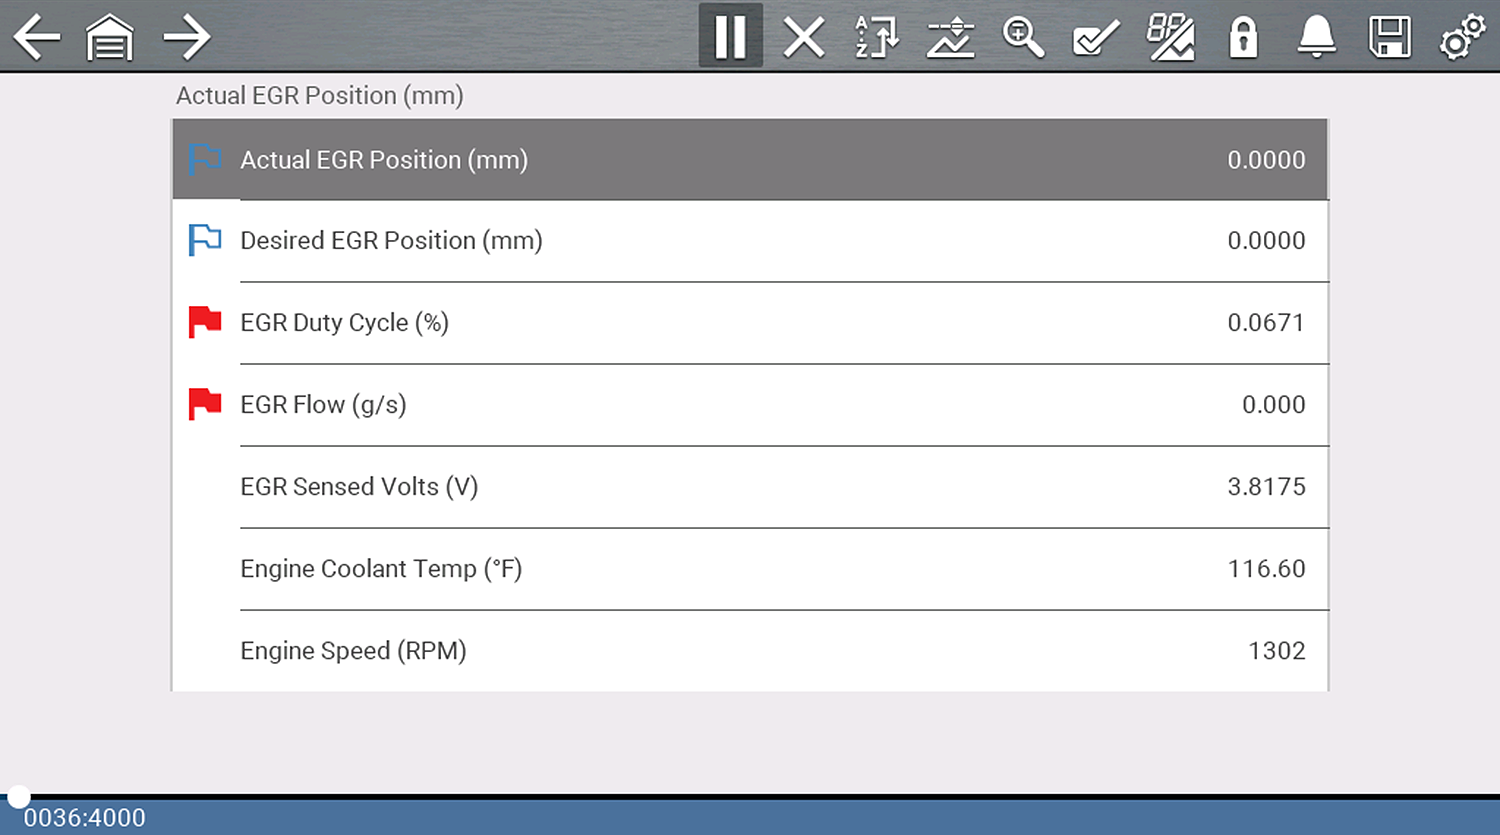
PID List View
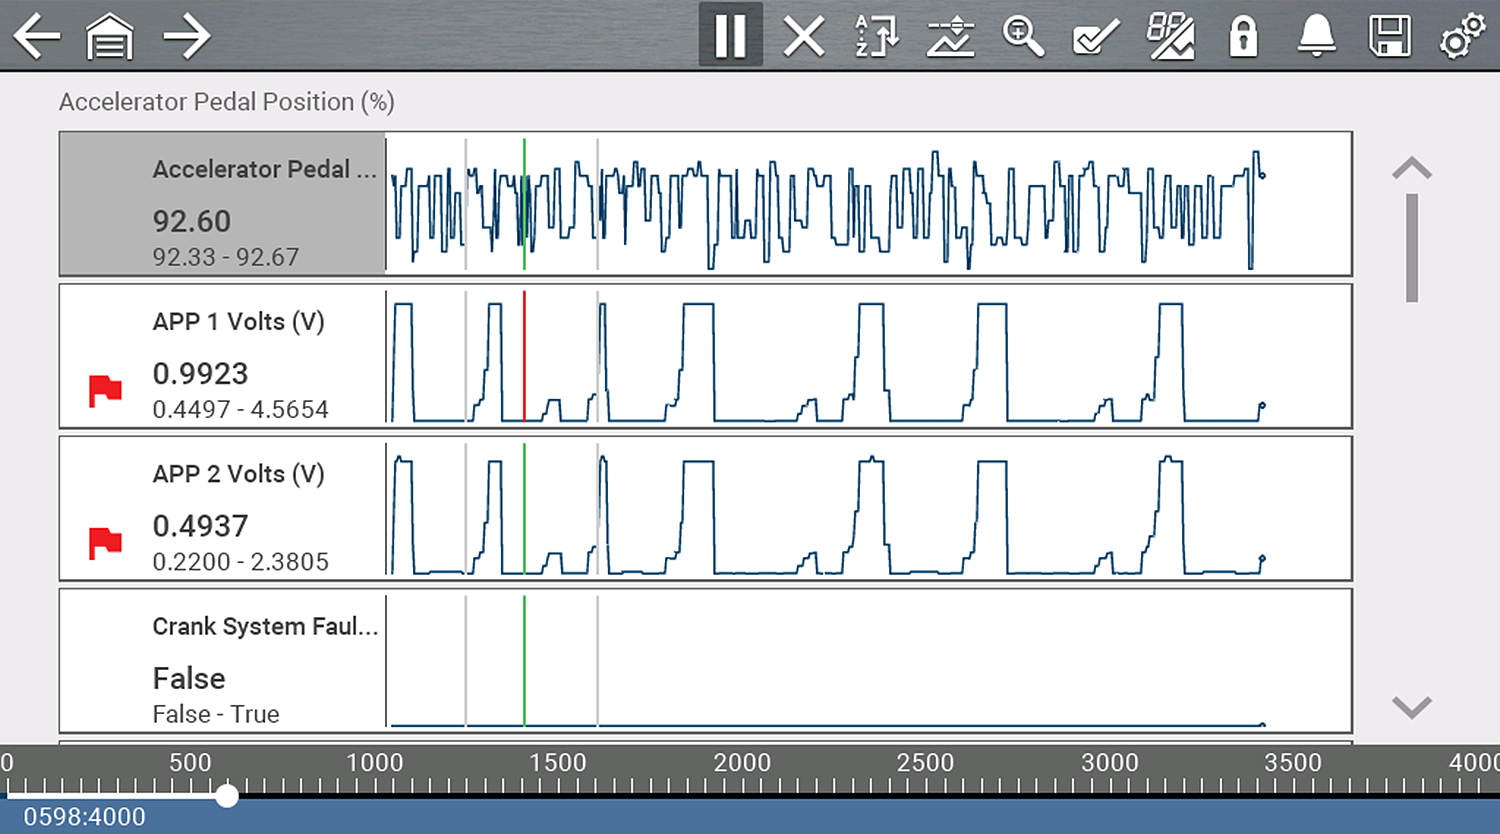
PID Graph View .
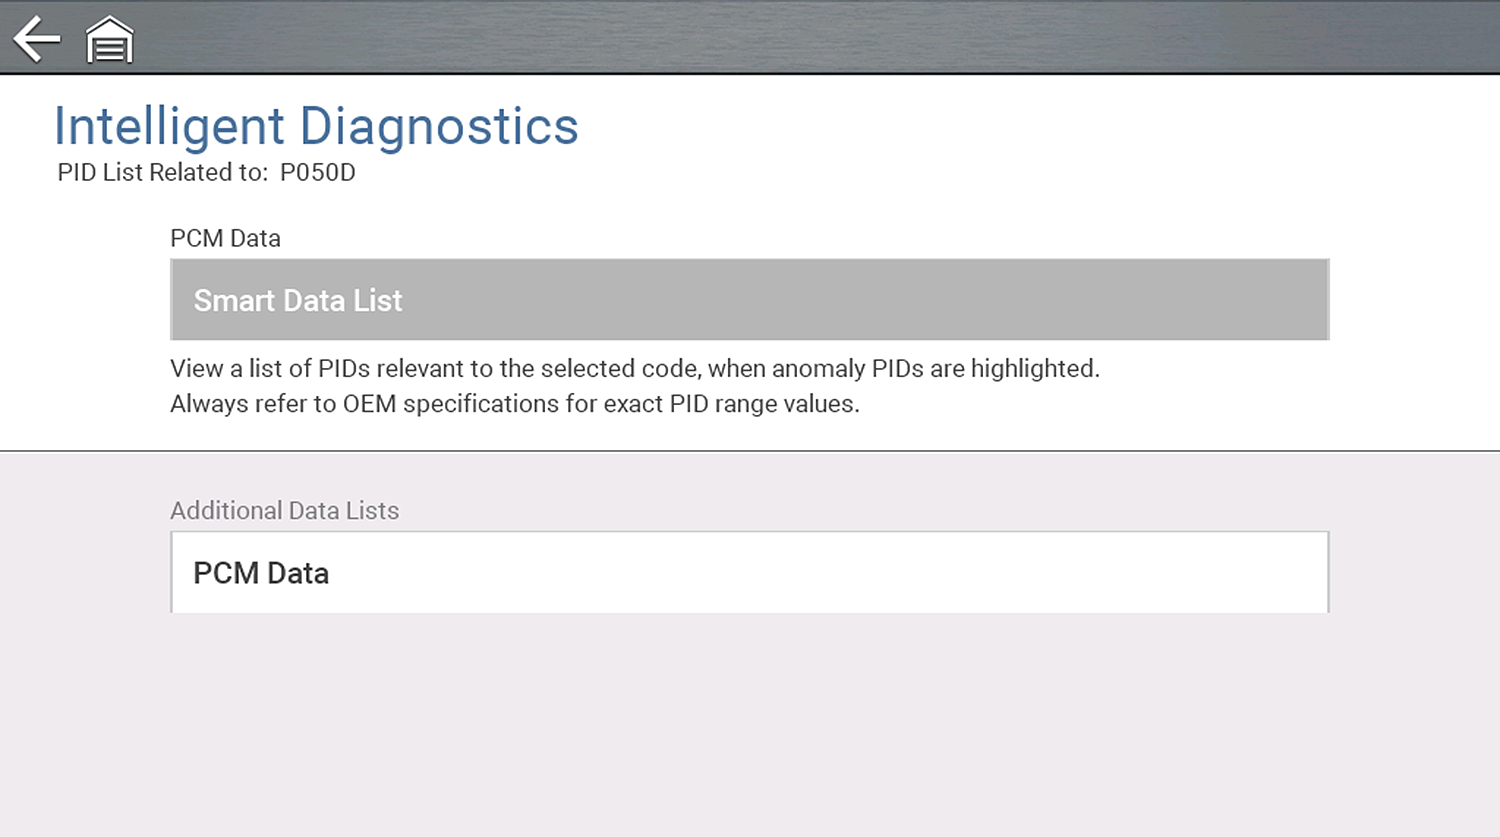
Selecting the Back icon opens the Smart Data main menu, which includes additional data list options (bottom of screen).
Features and operation of Smart Data PIDs:
| ● | Any PID with a flag displayed has been preset and prearmed. |
| – | A red flag  indicates the PID trigger has been activated and is operating out of range. indicates the PID trigger has been activated and is operating out of range. |
| – | A blue outlined flag indicates the PID is armed, and operating within it’s limits (trigger not activated). |
| ● | PID trigger points (upper/lower value limits) are automatically set using known-good upper/lower limit values. |
| – | Note - Upper/lower limit lines are not displayed on the graph, and values are not displayed in settings. |
| ● | Smart Data PID triggers can be (overridden) set manually, see Using Triggers for instructions. |
| – | Note - Manually setting trigger values will override the preconfigured Smart Data values. |
| – | Note - Manually set triggers will display upper and lower trigger limit lines in the graph. |
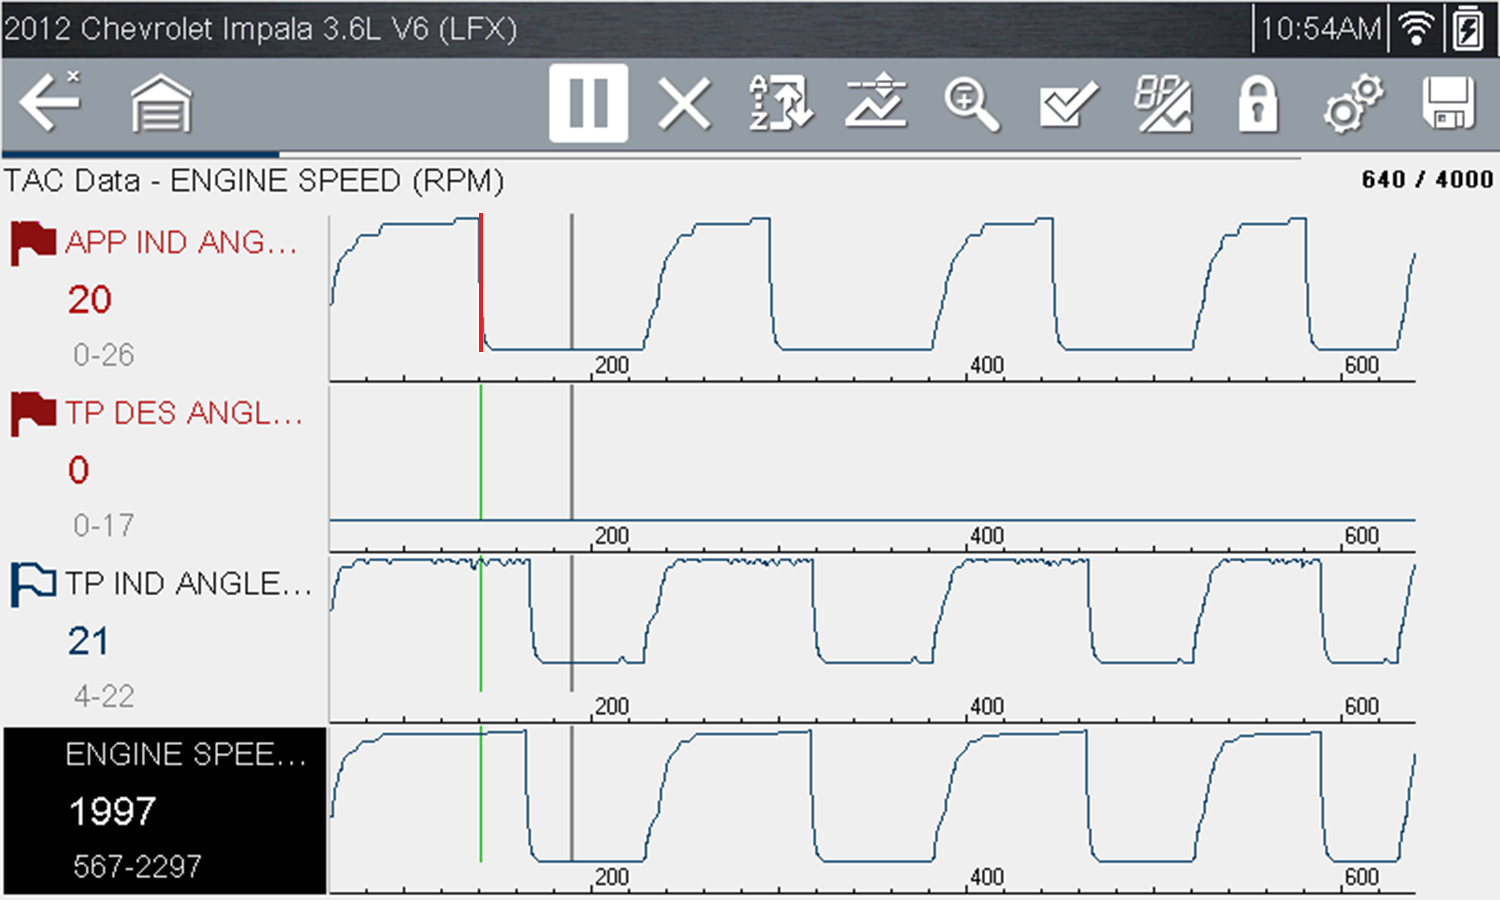
When a trigger is activated:
| ● | Data collection continues briefly after the trigger point, then pauses as the Scanner captures a recording of the data. Data is saved leading up to and just past the trigger point. |
| ● | An audible alarm is sounded |
| ● | A message displays indicating a data file was saved. |
| ● | Data collection continues. |
| ● | The activated PID trigger is disarmed. Note - if a different PID trigger is activated subsequently, an additional data file will be recorded. |
| ● | A red cursor line is displayed on the graph of the PID with the activated trigger to indicate where the trigger occurred. |
| ● | A green cursor line is displayed on all the other PID graphs to indicate their relationship to where the trigger occurred. |
| ● | A gray cursor line is displayed to indicate the point at which the data was paused to save the data file. |
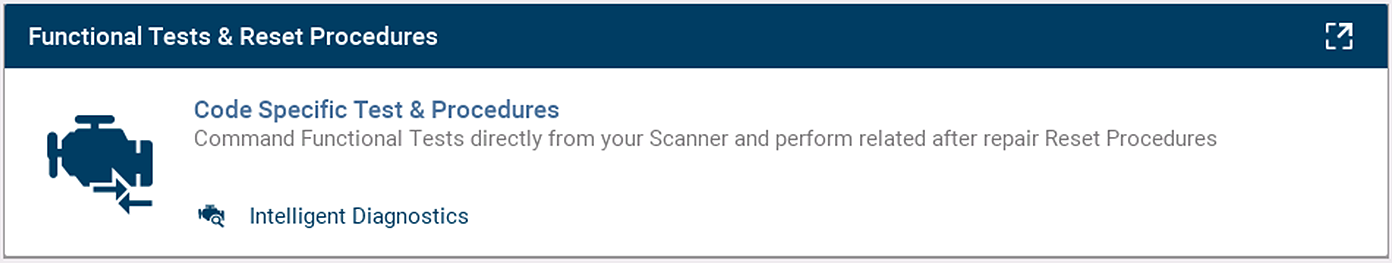
Functional Tests and Reset Procedures provides access to supported code related bi-directional tests (to verify component operation) and reset procedures (to complete the repair).
In addition, you can directly access all (not just code related) functional tests from one place, as compared to accessing them separately through the individual system menus.
For additional information see Functional Tests.
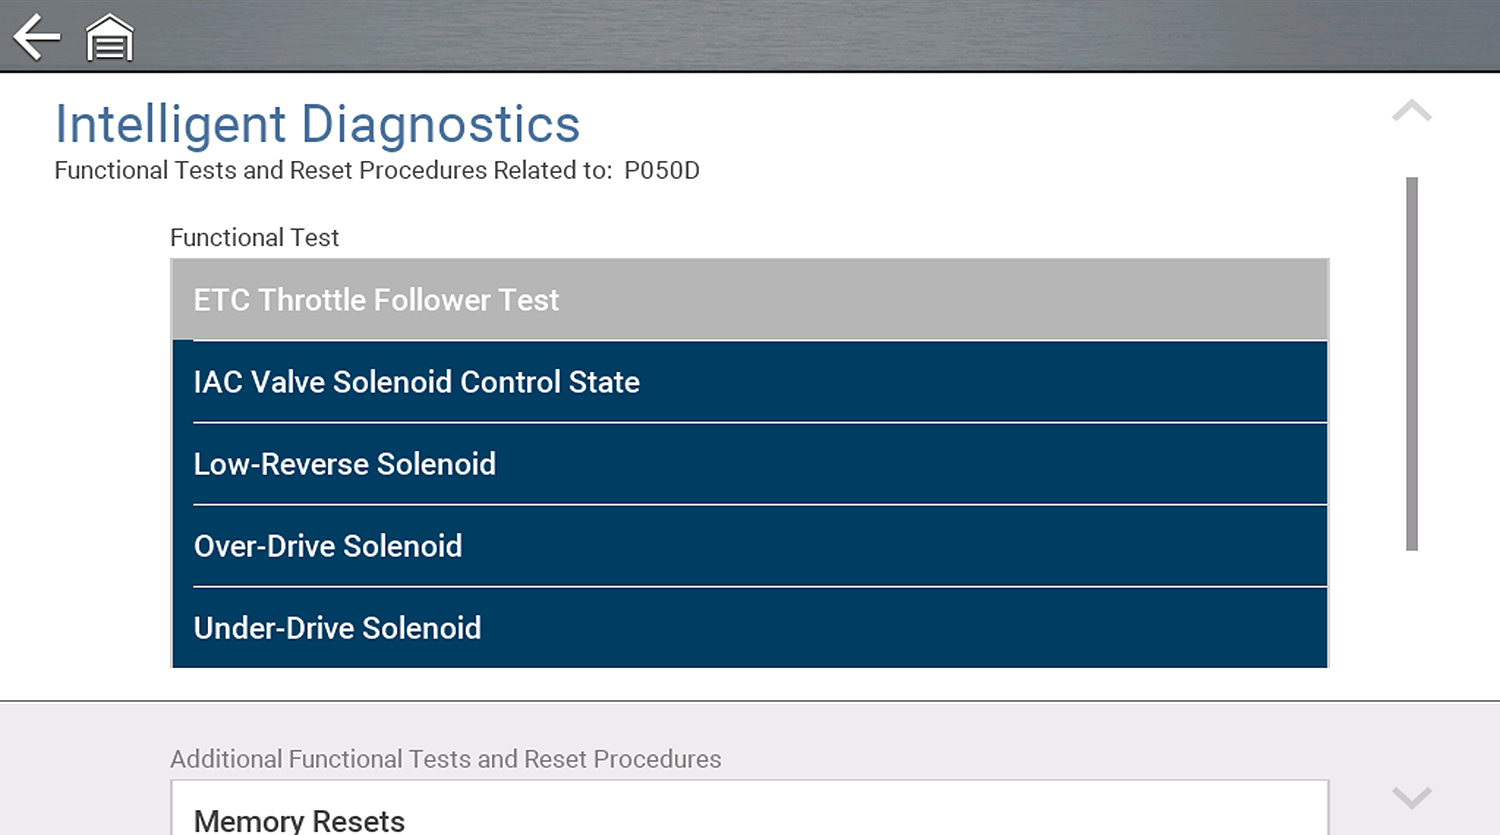
The upper list provides Functional Tests and Reset options related to the selected code. The lower list may provide additional Functional Tests and Reset options that are not code related, but are vehicle specific and may be useful in troubleshooting or validating repairs.
Selecting the Guided Component Tests card opens the Components Tests main menu , which displays a menu list of tests related to the troubleshooting of the selected codes.
Intelligent Diagnostics Guided Component Tests operation and navigation is similar to the main Guided Component Tests function accessed from the Home screen.
Additional Component Tests may be displayed at the bottom of the screen depending on the vehicle. These options are not DTC related, but are vehicle specific related, and may be useful in troubleshooting or validating repairs.
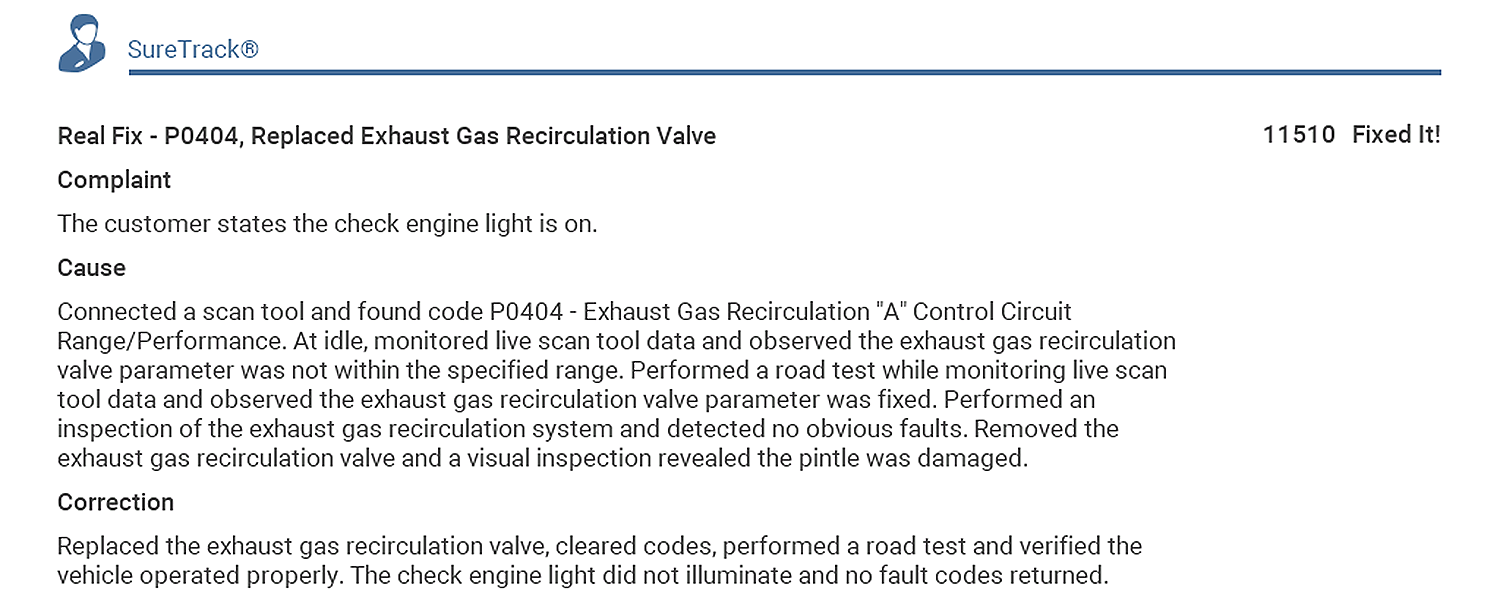
The Real Fix displayed on the Main Menu is the most common to date. The information is displayed in a Complaint - Cause - Correction format.
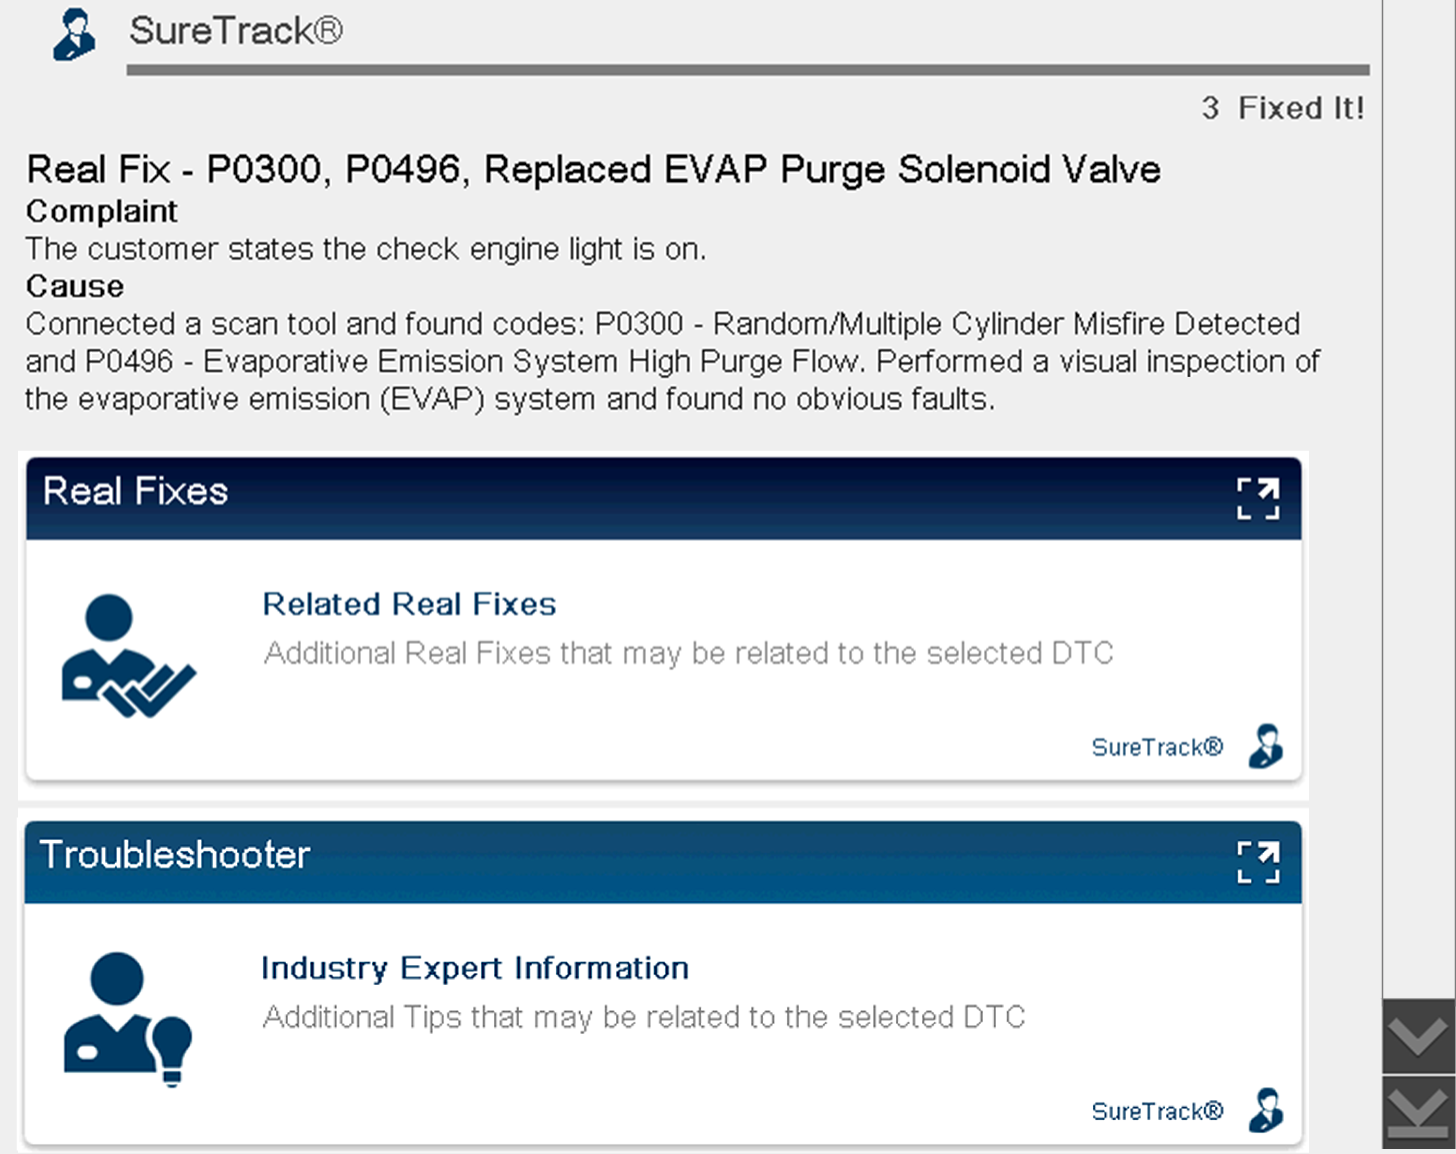
Real Fixes provides a list of available code-related procedures, tests and repair tips (Real and Related Real Fixes) obtained from actual shop repairs.
Fixes may not be available for every vehicle and/or DTC.
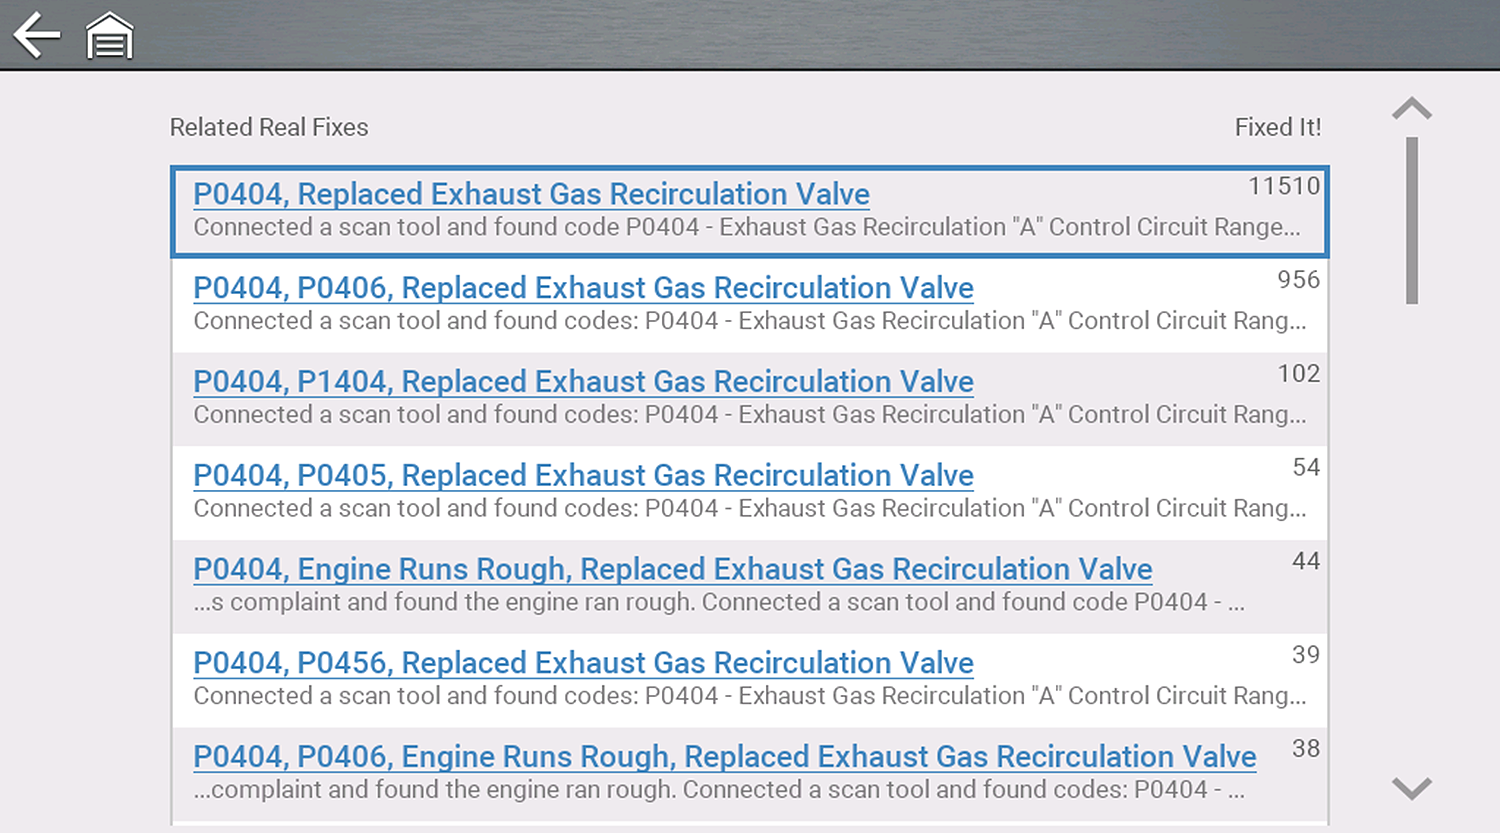
Select a Related Real Fix from the list to view detailed information about the fix in a Complaint - Cause - Correction format.
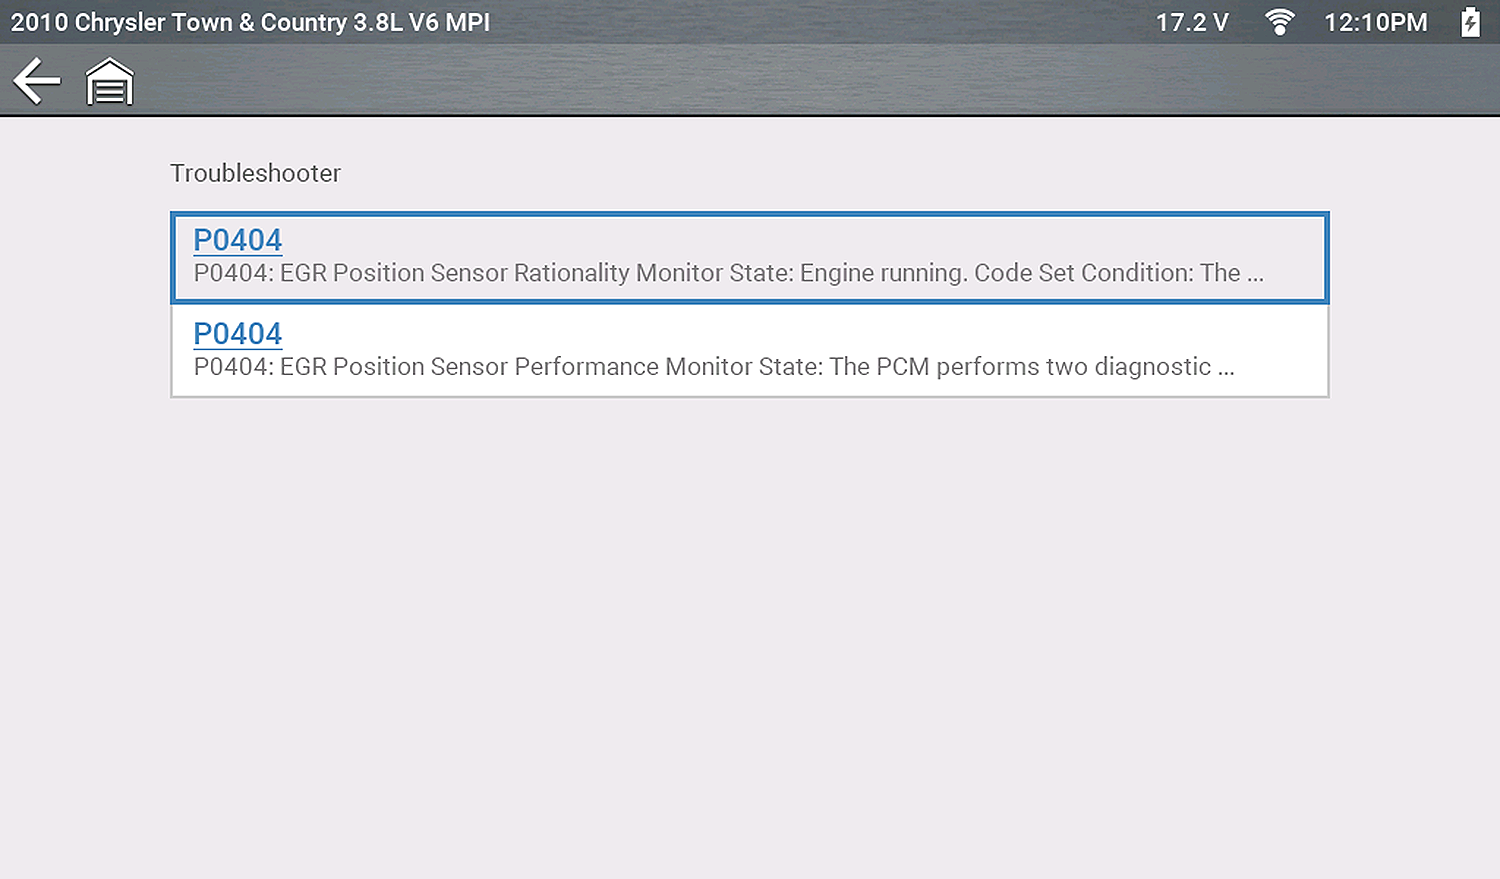
Troubleshooter provides a list of available code-related tips gathered from industry professionals.
Troubleshooter Tips may not be available for every vehicle and/or DTC.
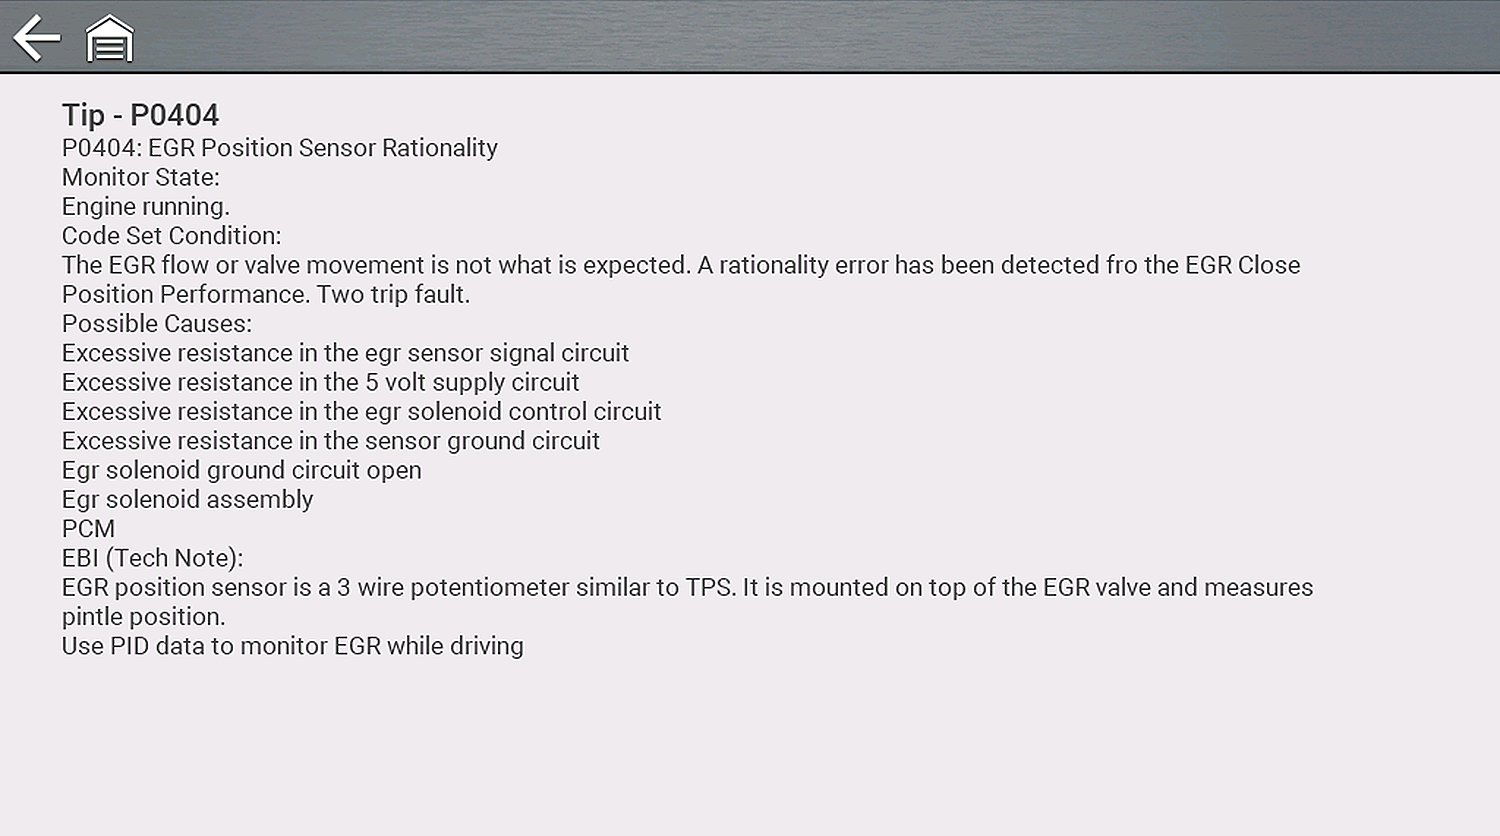
Select a Related Tip from the list to view the information.