The following sections describe common data functions.
Data functionality, availability, navigation and terminology is vehicle manufacturer dependent, and will vary.
Home Screen: Scanner (Vehicle Identification) > (Vehicle System Menu) > (Vehicle System Main Menu) > (Data)
To view Data, select Data and then make a sub-menu selection as applicable (if available). Depending on the vehicle manufacturer, the “Data” and sub-menu selection names will vary (e.g. Data, Data Menu, Data Only, Data Groups, Display Data, etc.).
The Data menu, displays available PID lists.
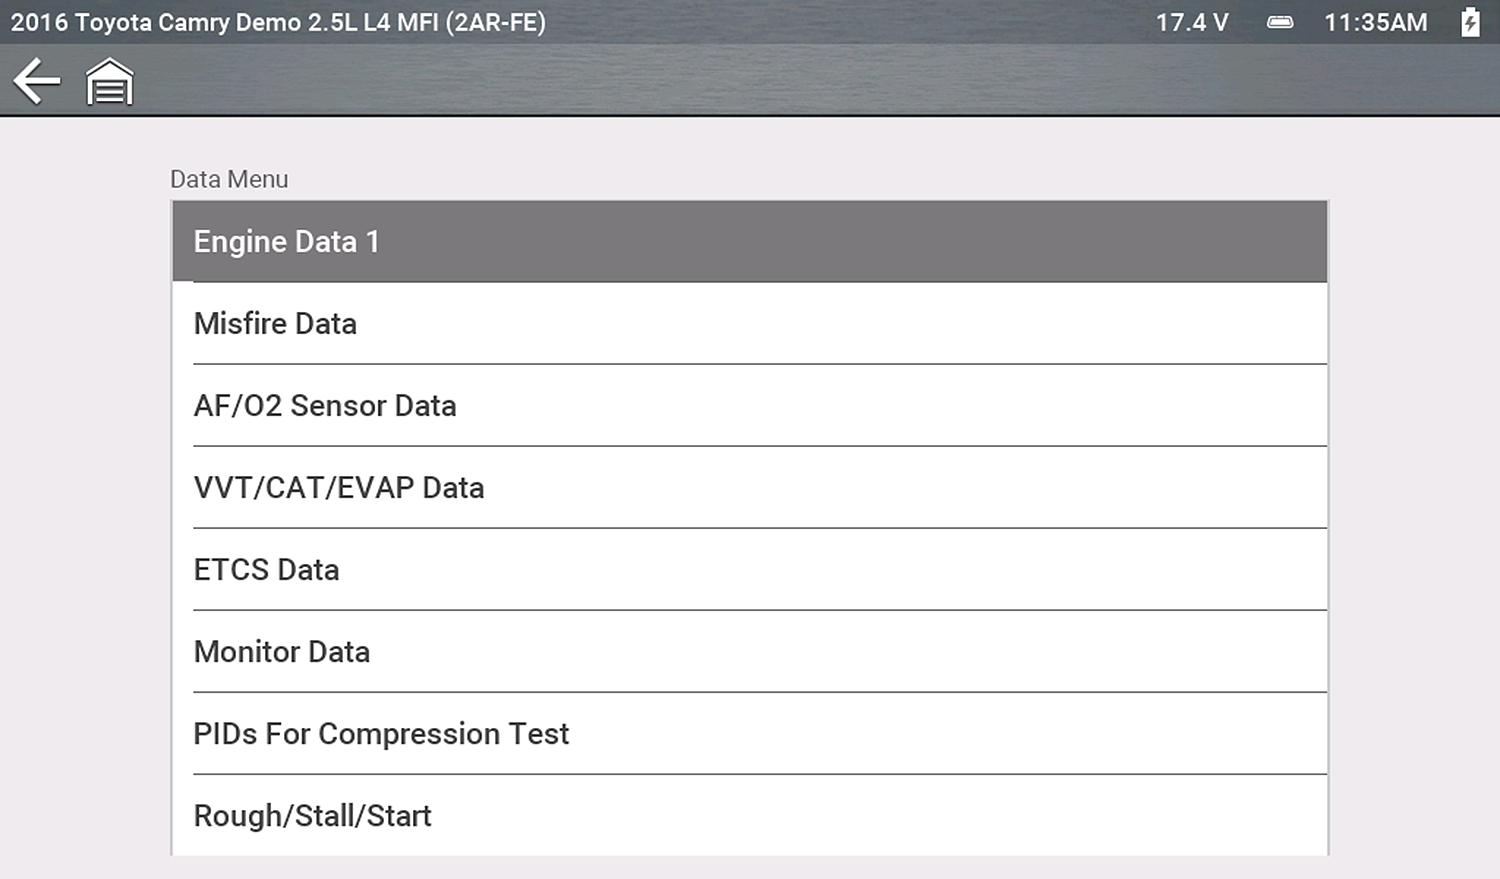
There are 3 basic PID list types:
| ● | All System Data - display all available PIDs for that system. As an example from within an Engine system Data menu, the Engine Data option can be used to display all Engine related PIDs. |
| ● | Related System Data - display a list of PIDs that are related to the primary system (e.g. Misfire, EVAP, and Fuel Trim PID lists are related to the Engine system). |
| ● | Custom Data - user defined list of PIDs |
Home Screen: Scanner (Vehicle Identification) > (Vehicle System Menu) > (Vehicle System Main Menu) > (Data) > (Specific Data List - e.g. Engine)
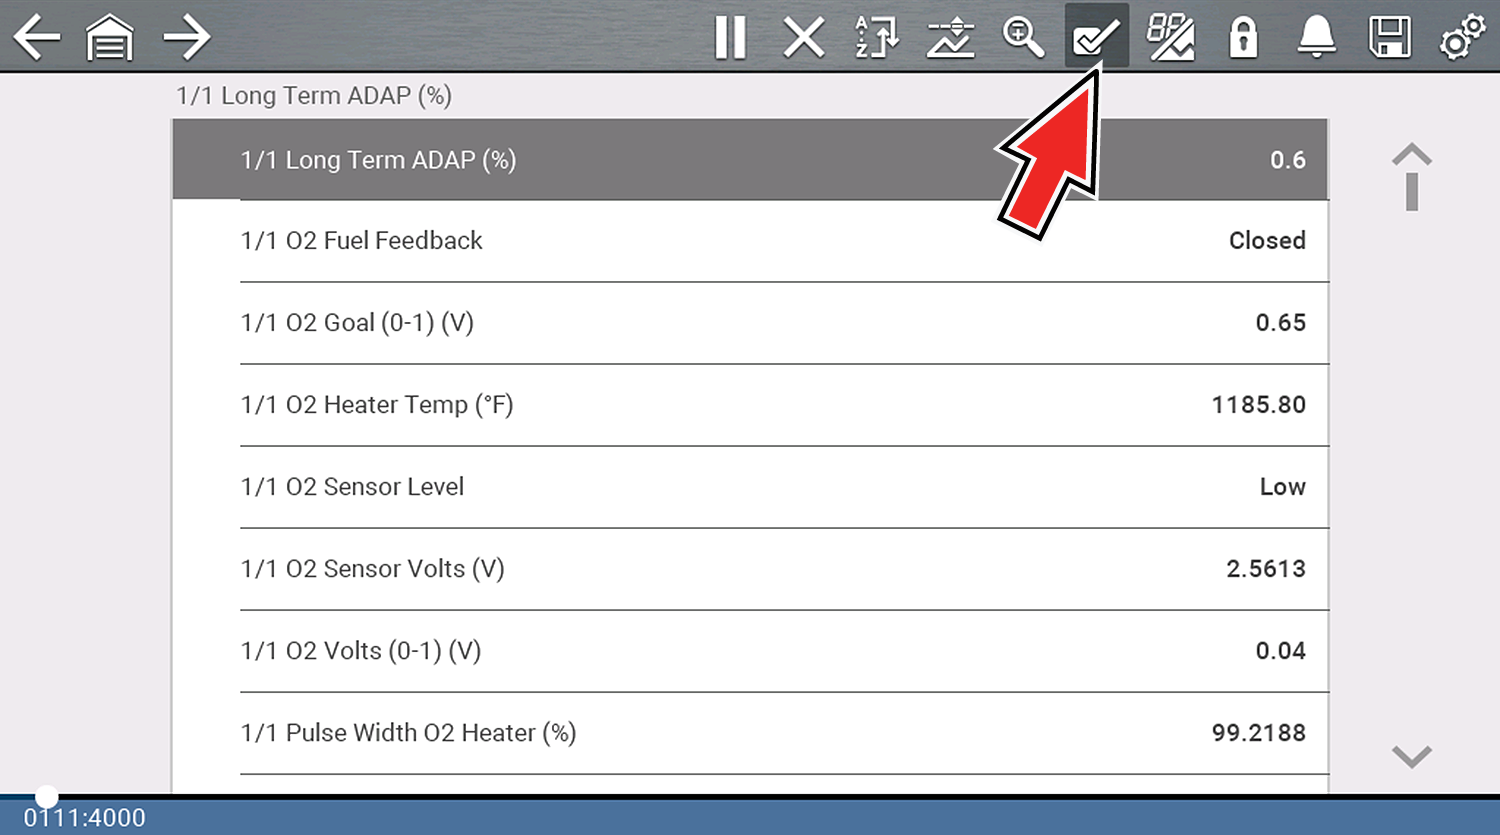
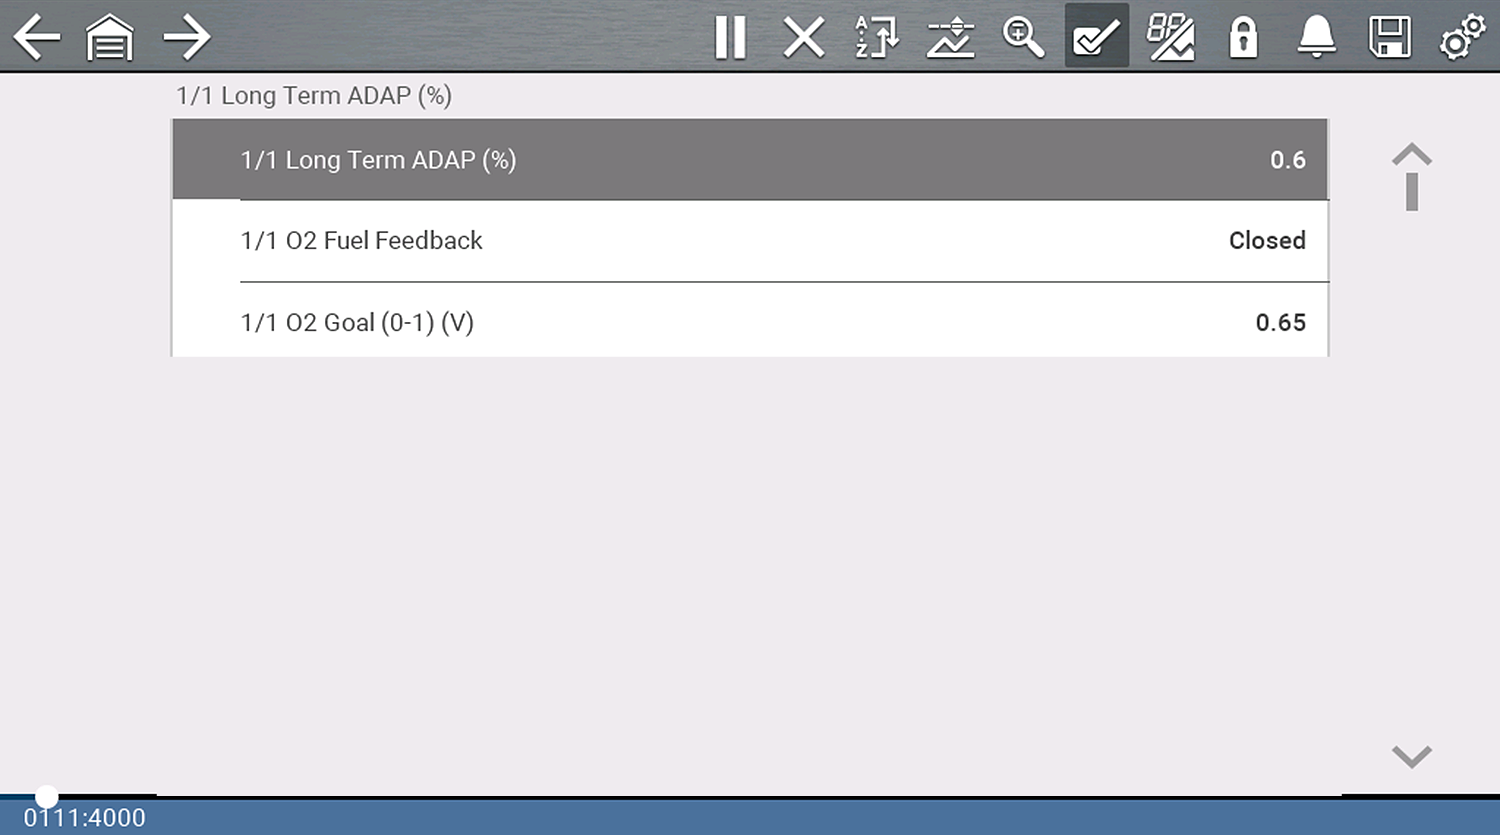
Select the Custom Data List icon  to create a custom PID list (add or remove PIDs from the list). Minimizing the number of PIDs displayed allows you to focus on specific data parameters and provides a faster refresh rate.
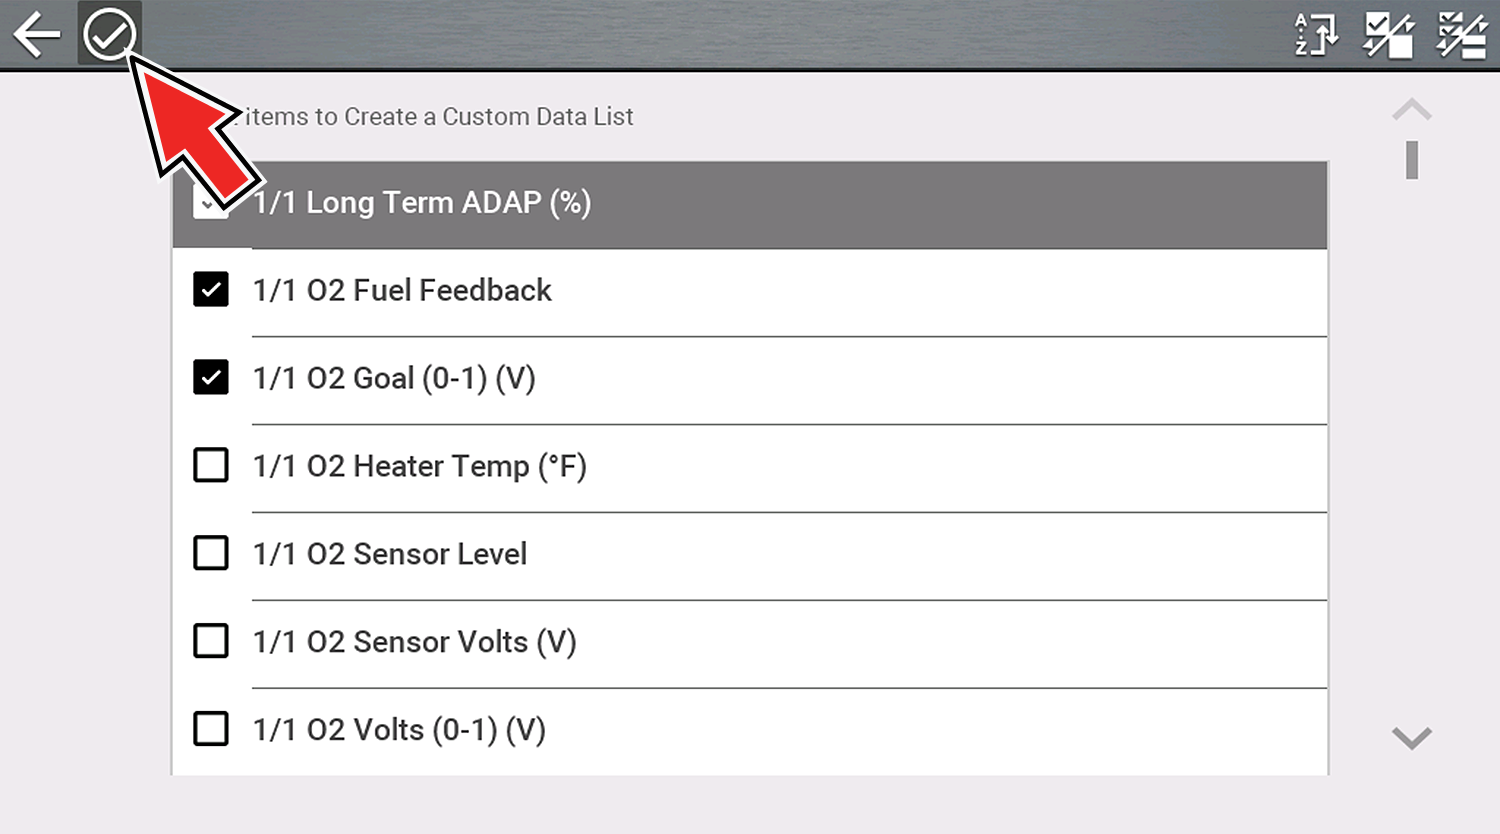
Check the parameters to display and then select the Accept icon. The custom list displays .
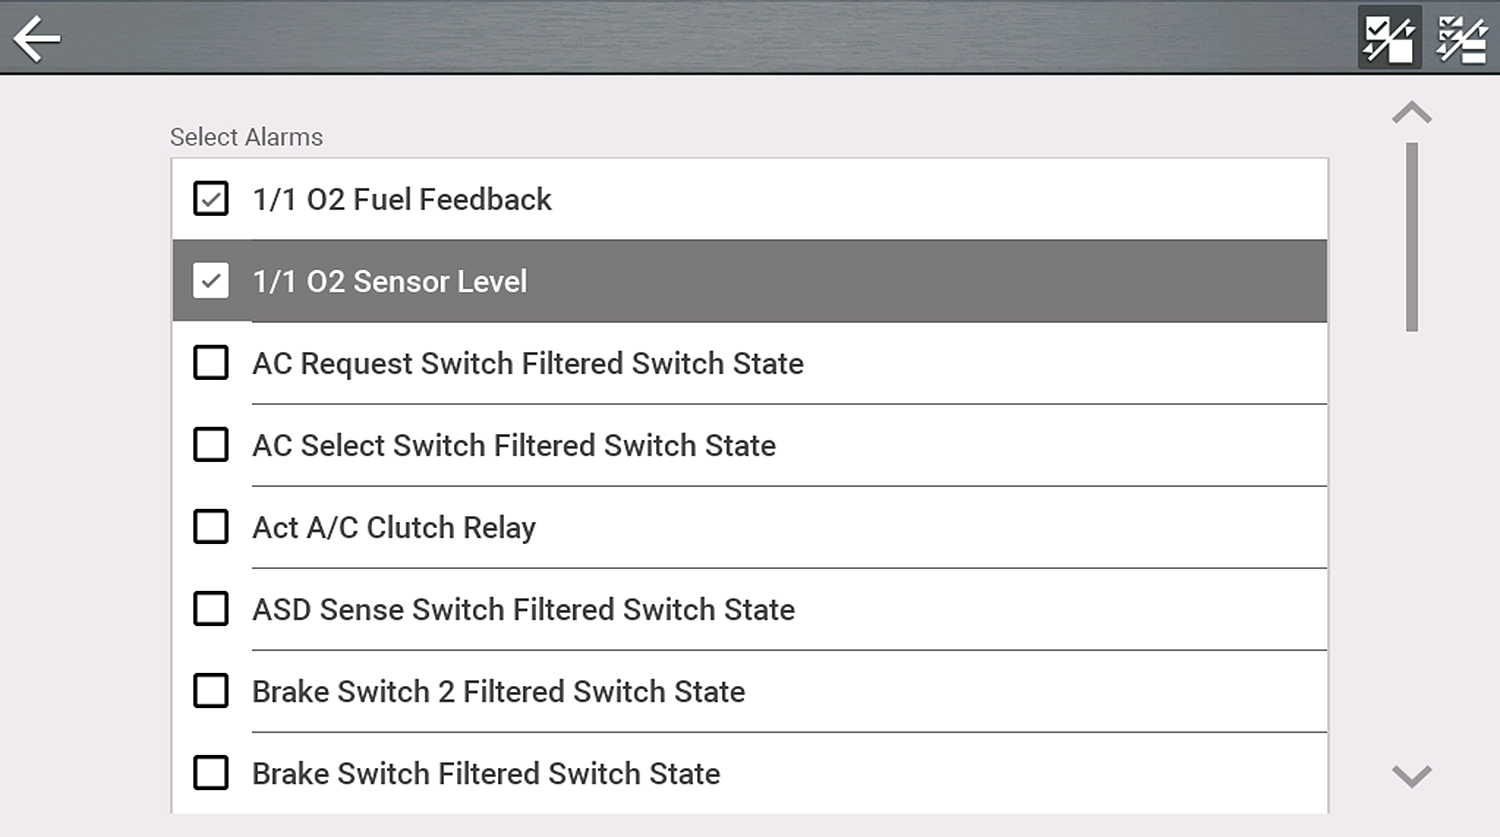
Visual (alarm) indicators can be set for two state PIDs. Two state PIDs include components and circuits that only operate in two modes or “states” (e.g. solenoids, relays, and switches that are either, open/closed, on/off, true/false, etc.).
To set two state PID Indicators, select the PID Alarm icon  .
.
Choose the PIDs indicators to display, then select the Back arrow.
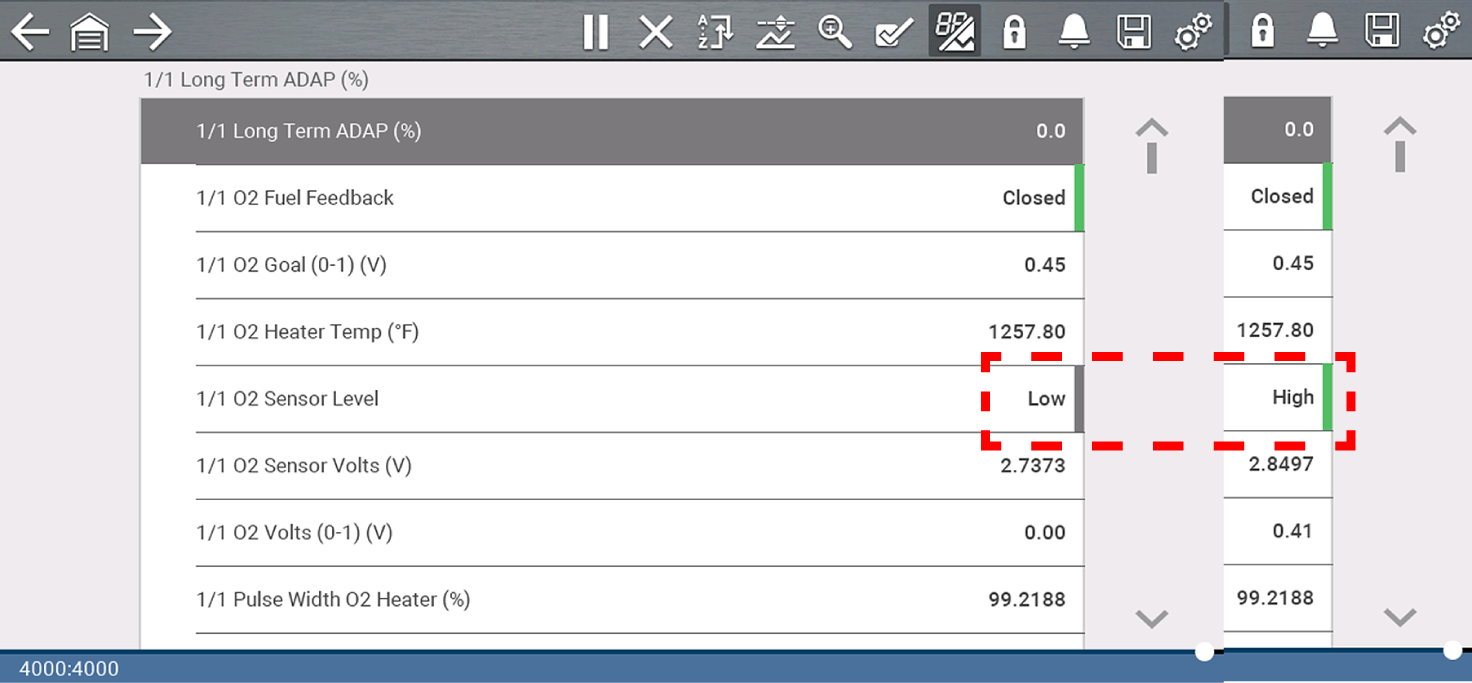
PID indicators are displayed in the data list, and change color as the states change.
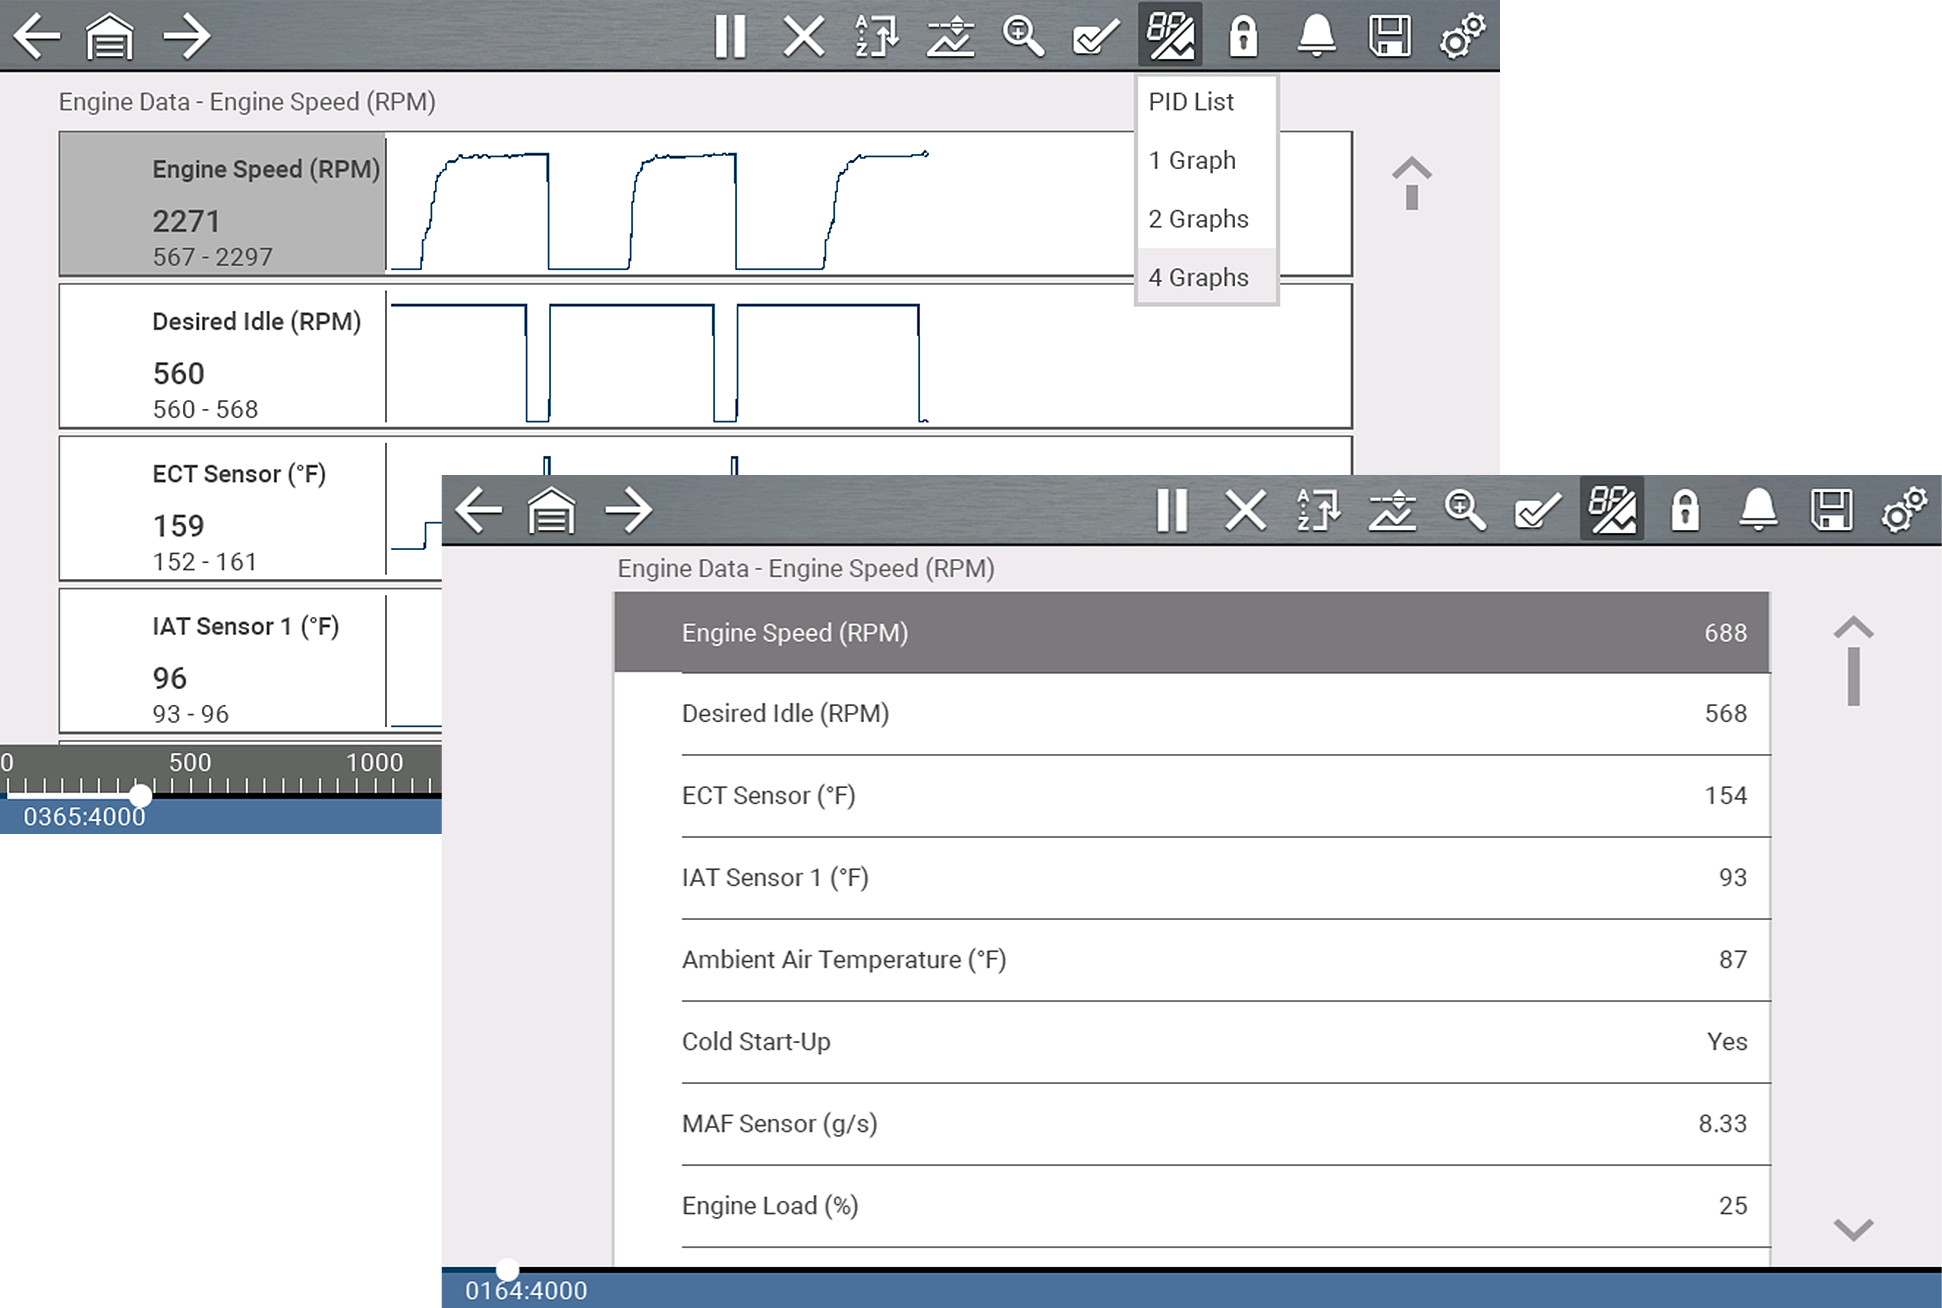
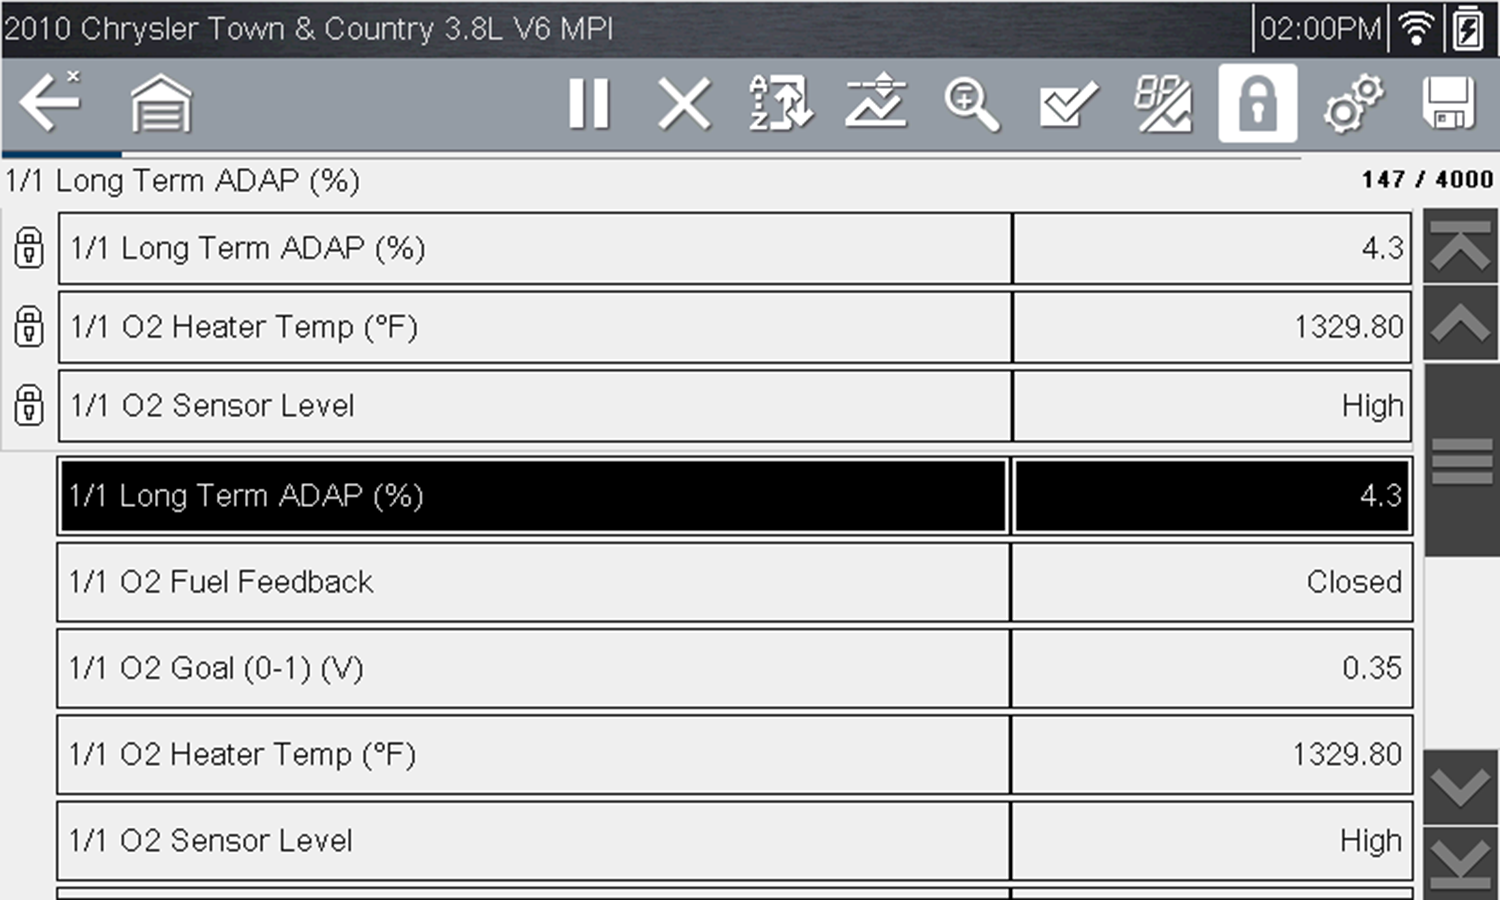
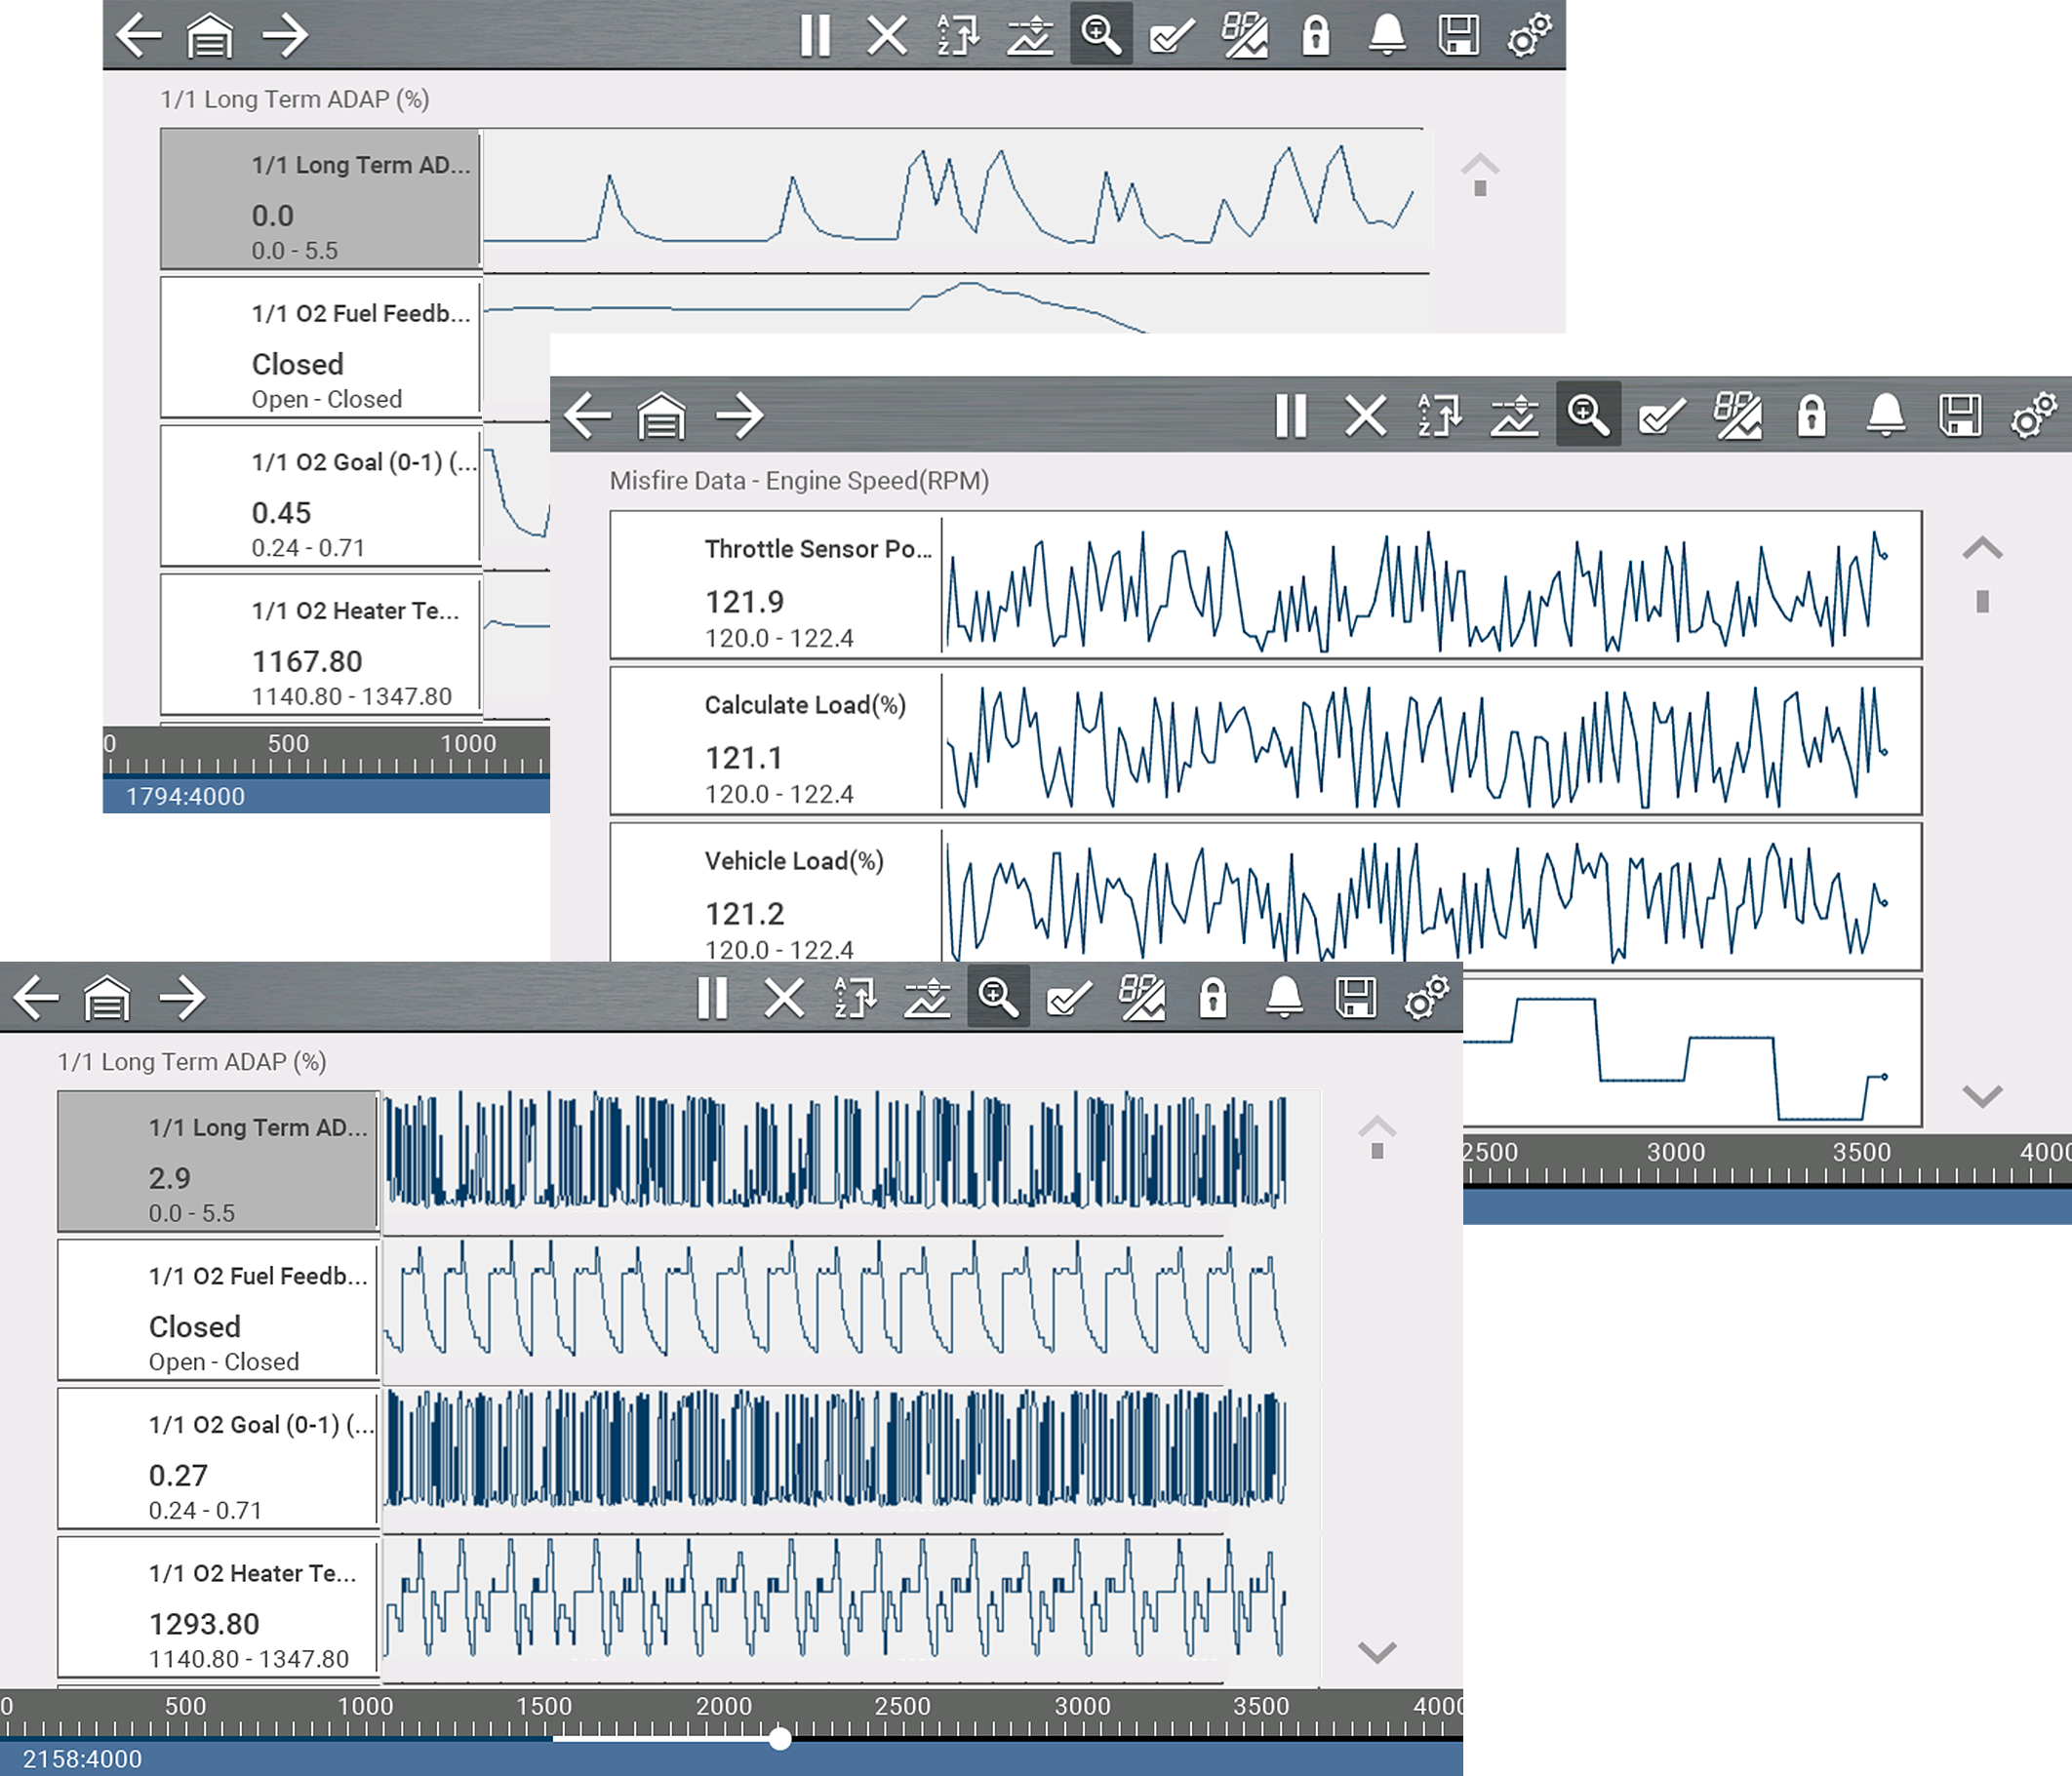
Data may be displayed in either list or graph form. The image below shows a four PID graph view (top) and PID list view (bottom).
To change the data display type, select the View icon  .
.
In all views, the current parameter value or state is shown, and the PIDs are listed in the order in which they are transmitted by the ECM.
Select the Right Arrow  to display the next data list when more than one list is available.
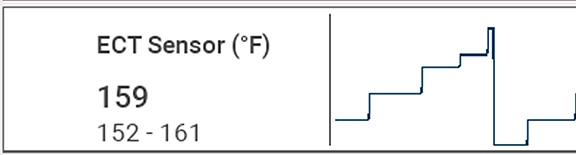
In graph view the text block to the left of the graph displays:
| ● | Top - PID description |
| ● | Middle - Current value or state |
| ● | Bottom - Active minimum and maximum values |
Use the Lock icon  to lock selected PIDs at the top of the list.
To lock or unlock a PID, highlight the parameter and select the Lock icon.
Only three parameters can be locked at one time. Once locked, a parameter remains locked until it is manually unlocked, or communication with the vehicle is stopped.
The diagnostic tool has the capability to collect, store and save PID data utilizing internal storage memory and buffer memory.
When data is displayed onscreen, a data buffer automatically starts to store it in buffer memory. The data buffer runs continuously (storing data) until the Pause, Clear, or Save icon is selected.
Buffer memory is limited to a predetermined “total” size. When buffer memory reaches it’s full capacity, the data buffer will continue to store new data, however earlier stored data will be removed to allow room for the new data being stored.
The most recent data is always available for review when Pause is pressed, and can be reviewed using the toolbar controls.
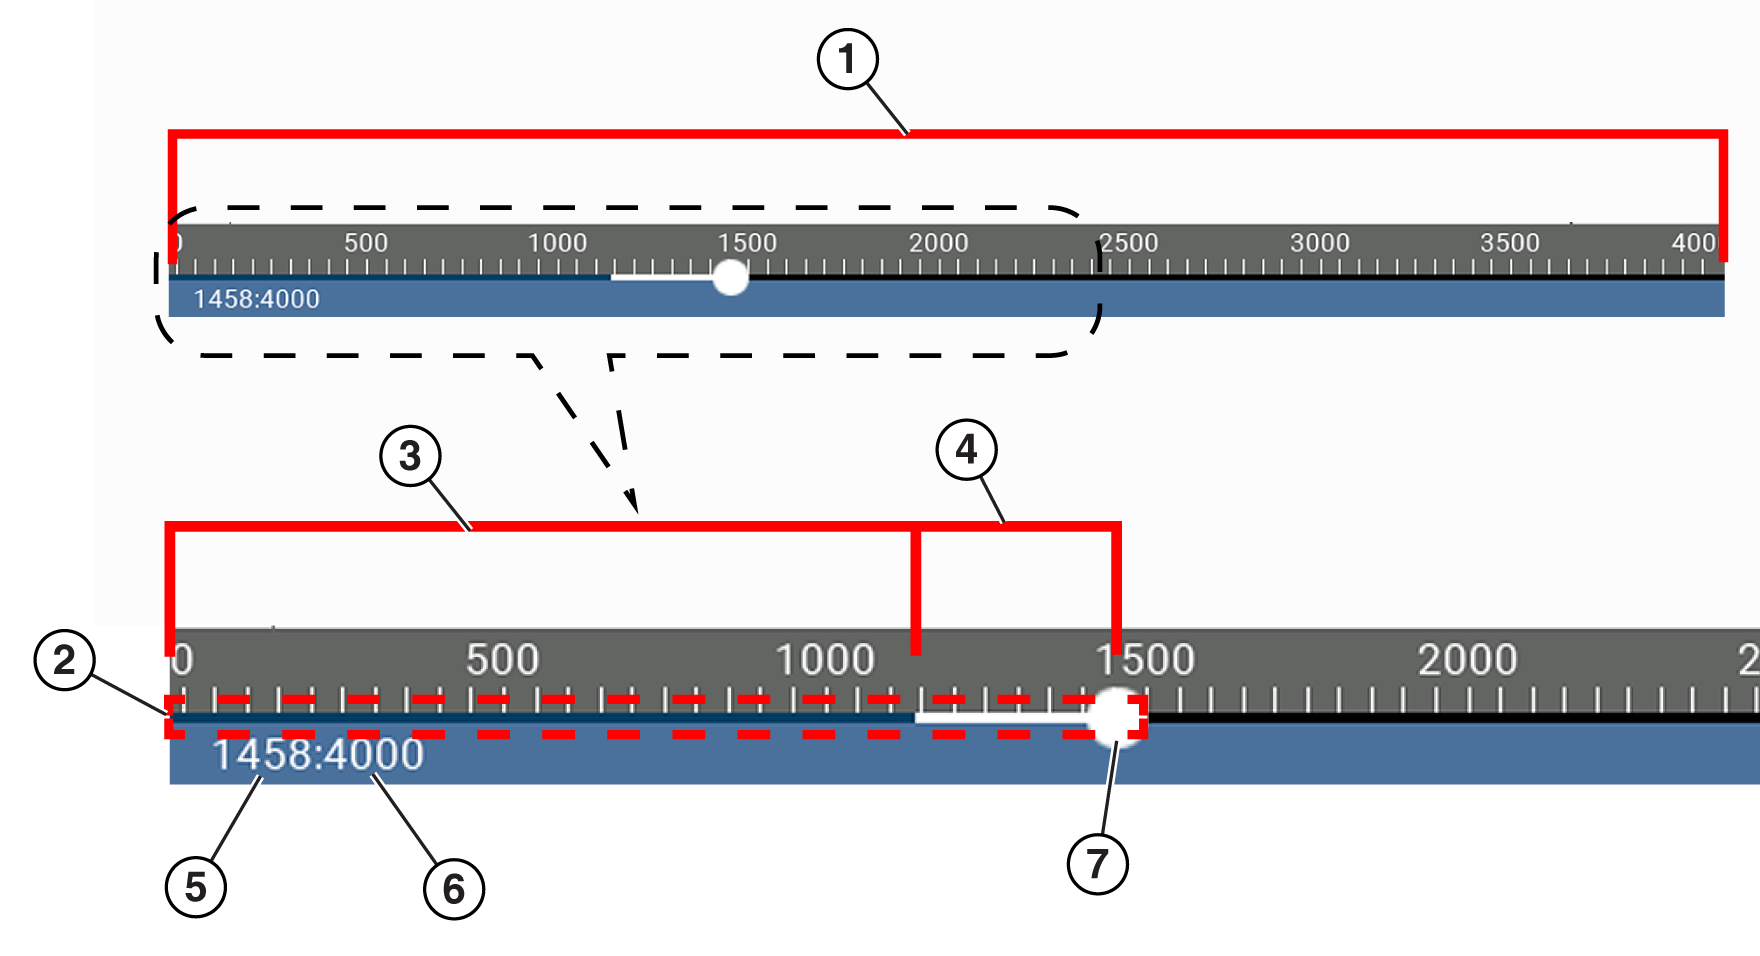
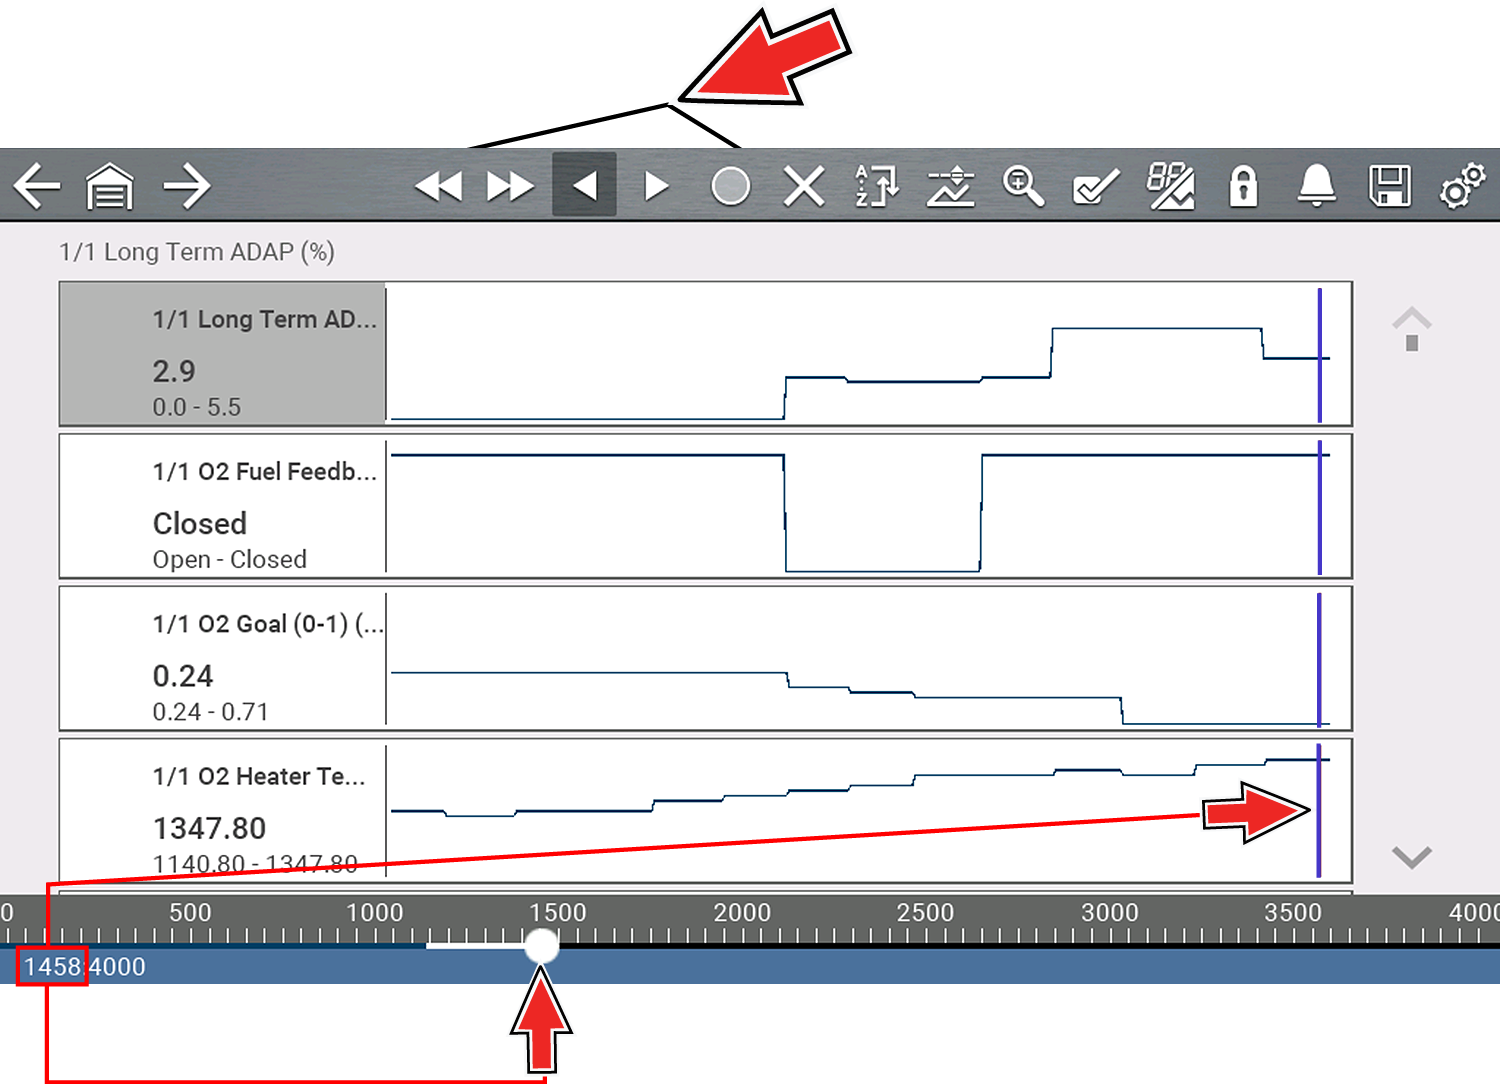
| 1. | Data Buffer Scale - Displays maximum data buffer size (e.g. 4000) across screen |
| 2. | Data Buffer Indicator - Bar graph indicates total data stored in the memory buffer. Includes blue and white graph bars and active position indicator. |
| 3. | Blue Graph Bar - Stored data not displayed onscreen |
| 4. | White Graph Bar - Stored data displayed onscreen |
| 5. | Active Data Position Counter - the numerical position of the active (current) data point as displayed within buffer memory. |
| 6. | Maximum Data Buffer Size (Data Buffer Position Counter)- indicates the maximum data buffer size value (e.g. 4000) |
| 7. | Active Data Position Indicator - Round icon indicates active (current) position in the data, which is also denoted by the Active Data Position Counter. |
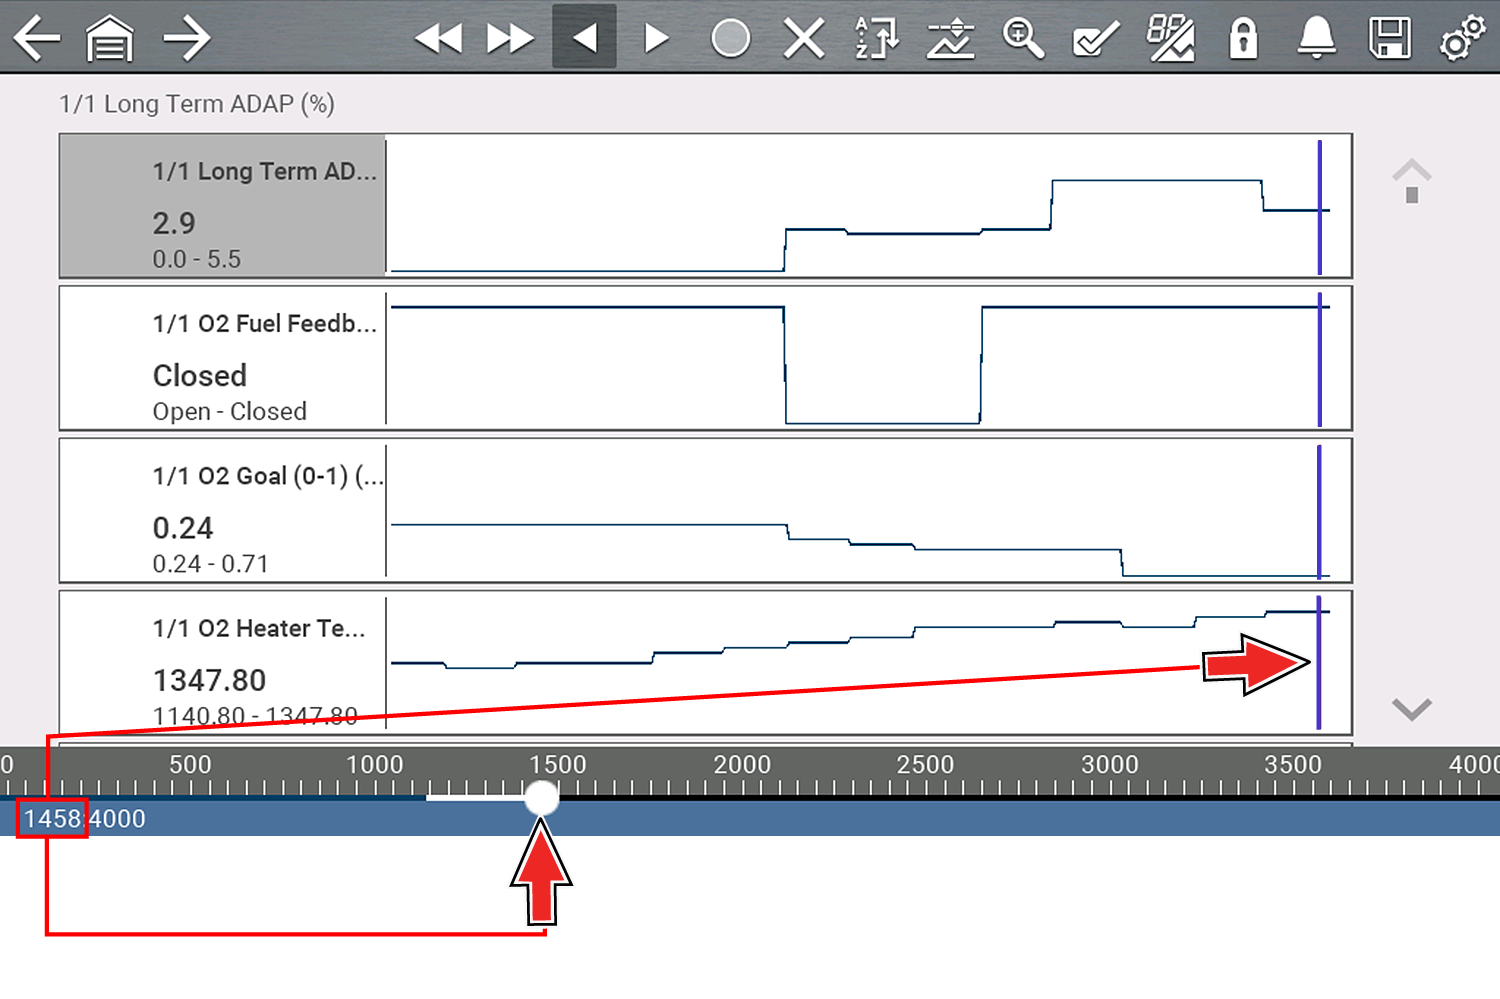
This image shows the relationship between the (Blue) Current Position Cursor, Active Data Position Indicator and Active Data Position Indicator during data review.
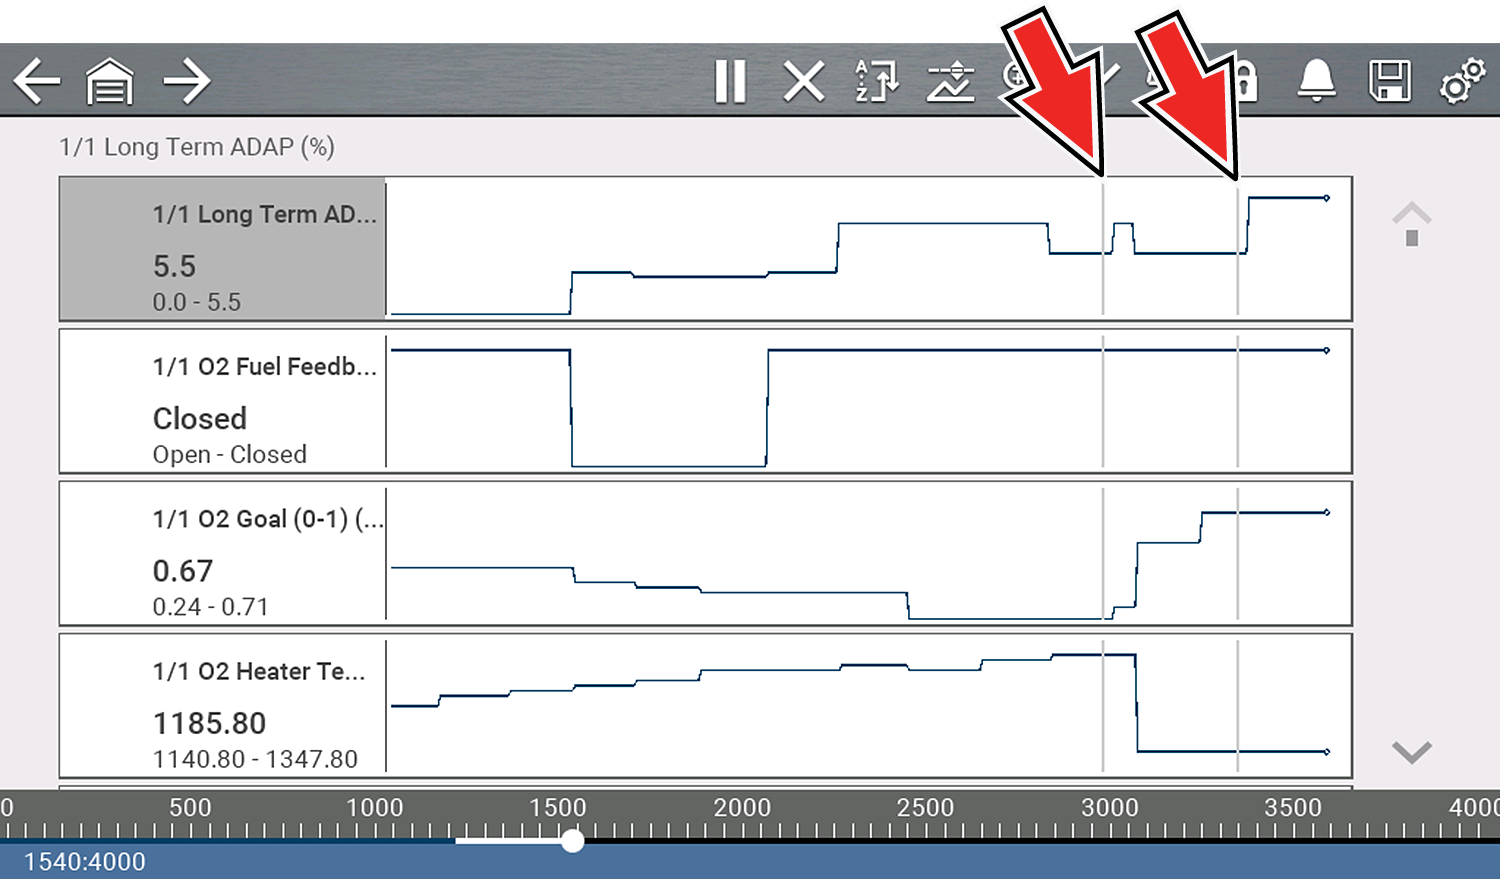
Vertical cursors are automatically displayed (in graphical PID views) to mark specific data reference points.
Gray (Pause/Save) - If you select Pause or Save while collecting data, a vertical gray cursor is automatically placed at that point in the data to indicate where the data was paused or saved.
| ● | Each time Pause is pressed an additional cursor is added, and appears when Start is pressed to resume data collection. |
| ● | Each time Save is pressed an additional cursor is added, and appears when the data starts again after a slight pause to save the file. |
| ● | Cursors are displayed in all PIDs as reference markers. |
| ● | Cursors are retained and appear in saved data files. |
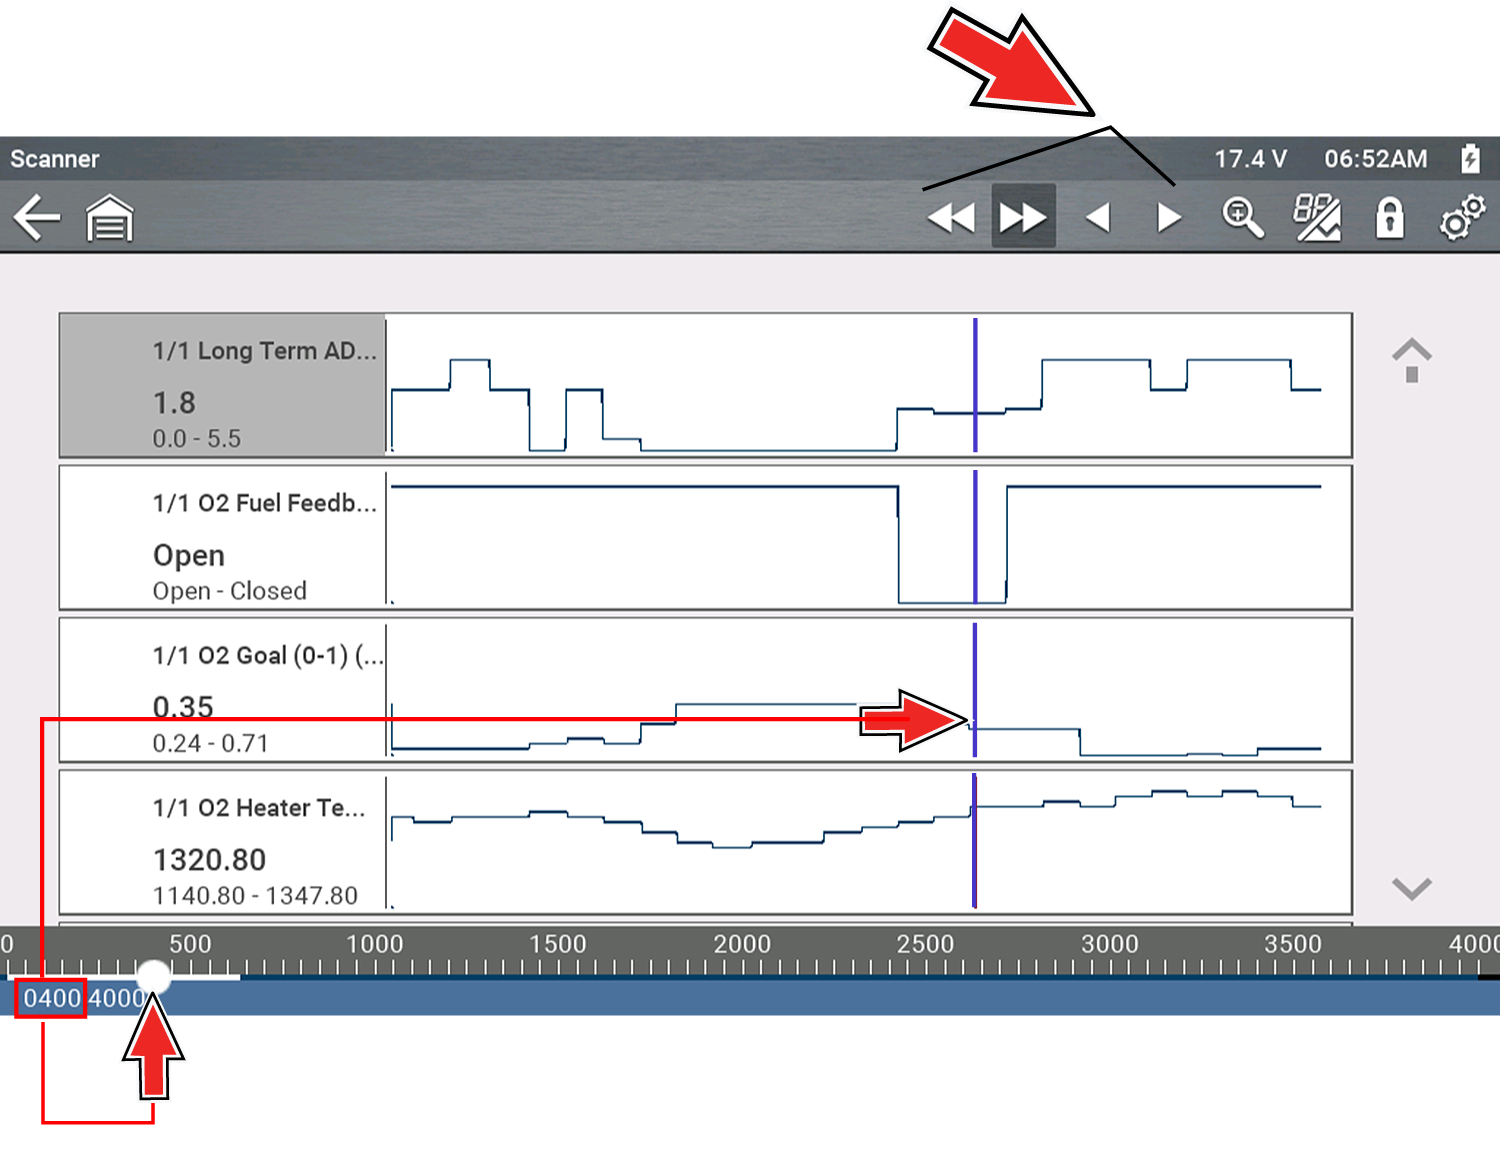
Blue (Current Position) - If you select Pause while collecting data, a vertical blue cursor is displayed as an indicator to your position in the data and is denoted by the current position value in the counter display.
| ● | Cursors are displayed in all PIDs as reference markers. |
| ● | Depending on the amount of data saved the blue cursor may be initially located on the far left next to the description, or the far right next to the scroll bar making it difficult to see. If this happens, use the control icons (Step/Skip) to move the data until you can see the cursor. |
Red (Triggered PID Activation Point) - When using triggers, a vertical red cursor is displayed in the data of the triggered PID at the point where the trigger was activated.
| ● | When multiple PIDs are armed, only the PID that is triggered first will display a red cursor. |
Green (Trigger Activation Reference Point) - When using triggers, green vertical cursors are displayed in all PIDs (except the PID that was triggered) as reference to the triggered PID activation point.
| ● | When a trigger is activated the displayed red and green cursors are all vertically aligned in the graphed data to show the relationship of the trigger point in all PIDs. |
During normal operation, data from the vehicle is continuously being stored in buffer memory as it is displayed onscreen. The Pause icon, allows you to temporarily pause data collection to review it in detail.
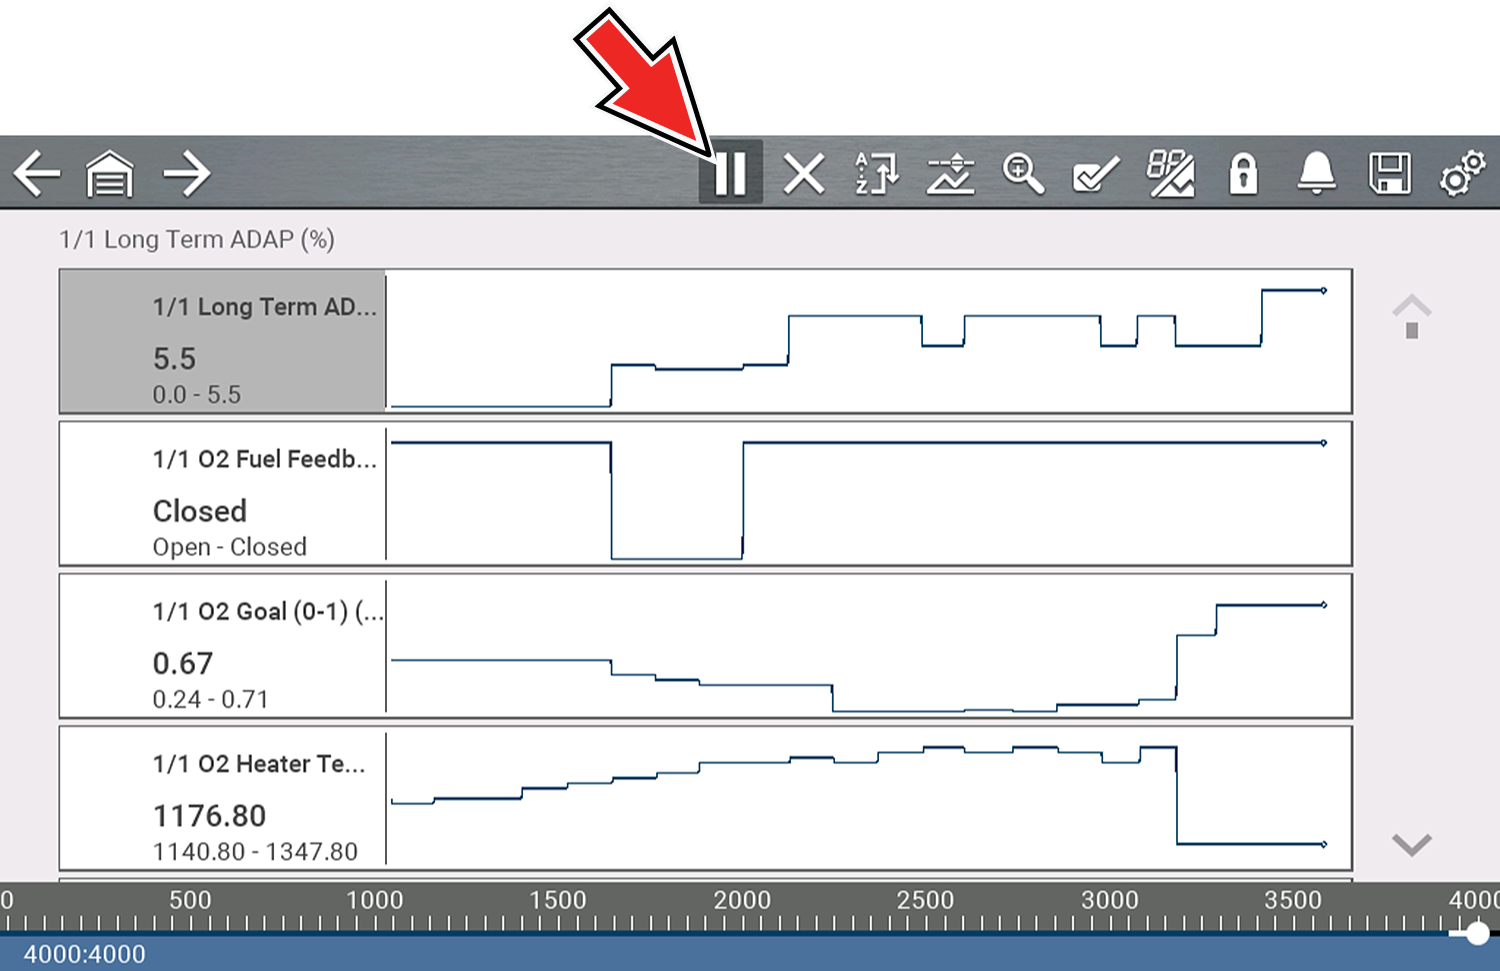
After Pause is pressed:
| ● | Use the review control icons to accurately move through the data. |
| ● | The blue (vertical cursor) indicates your position in the data and is denoted by the current position value in the counter display. This cursor displays in all PIDs. |
To resume data collection (after pausing), select the Start icon  .
.
| ● | The screen changes back to display data . |
| ● | A vertical gray cursor is displayed on all PIDs, indicating where the data was paused . If Pause occurred more than once, gray cursors will be used for each instance. |
Saving data is useful when trying to isolate an intermittent problem or to verify a repair. During normal operation, data from the vehicle is continuously being stored in buffer memory as it is displayed onscreen. Selecting the Save icon  writes stored buffer memory to a (.SCM) file.
The Save icon performs the same function as “Save Movie” function choice for the programmable Shortcut button, see Configure Shortcut Key for details.
Viewing Data Files on the Tool
Home Screen: Previous Vehicles and Data > Saved Data
| 1. | Select the desired data file (.SCM file extension), see Saved Data for additional information. |
| 2. | Change the view type and zoom levels as needed. |
| 3. | In graph view, use the control icons to move through the data . |
The blue (vertical cursor) indicates your position in the data and is denoted by the current position value in the counter display. The cursor displays in all PIDs.
Depending on the amount of data saved the cursor may be initially located on the far left next to the description, or the far right next to the scroll bar making it difficult to see. If this happens, use the control icons to move the data until you can see the cursor.
Saved data files can also be downloaded to a personal computer (PC) using the supplied USB cable and ShopStream Connect™.
The zoom function allows you to change the magnification level of the graphed data during data collection and review. Changing magnification levels allows you to compress or expand the displayed data to quickly find glitches, or signal losses.
When the Zoom icon  is selected the dropdown menu allows you to select the display magnification level from a range of -2X to +8X. The "Zoom Out" option displays up to half of the maximum amount of data that can be collected, on one screen. The default magnification level is 1x.
Examples : Top (+4X), Middle (1X), Bottom (Zoom Out)
Trigger Description and Features
Setting PID triggers  allows you to configure the diagnostic tool to automatically save PID data to a file when a PID value meets an upper/lower limit (trigger point).
When a PID value meets the trigger point it activates the trigger which captures a short recording of PID data (before and after the trigger event), and saves it as a data file.
You can then review the file to evaluate the PID that triggered the event, and all the PIDs collectively to determine what happened up to and just past when the event occurred.
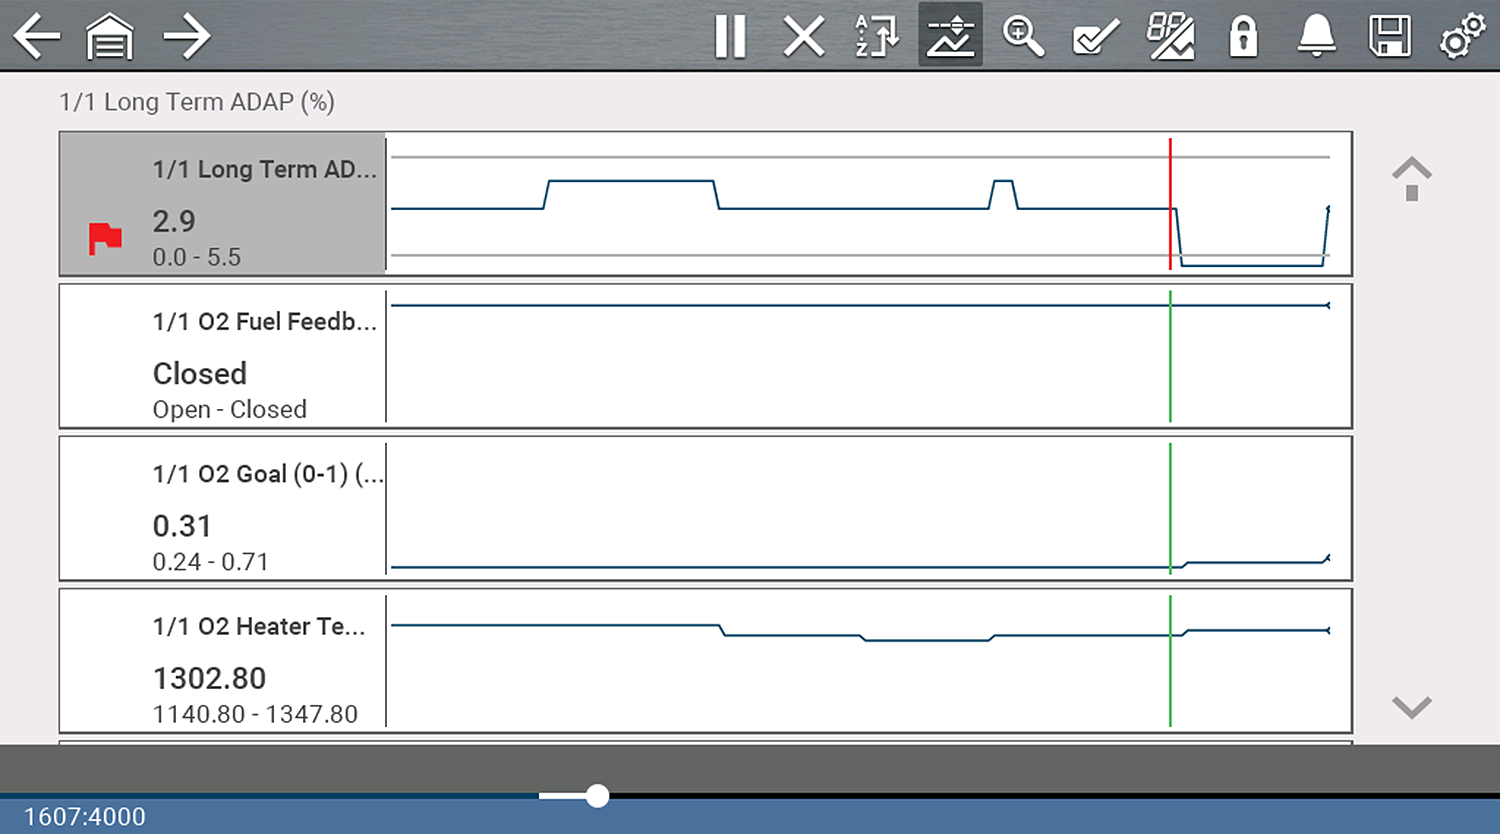
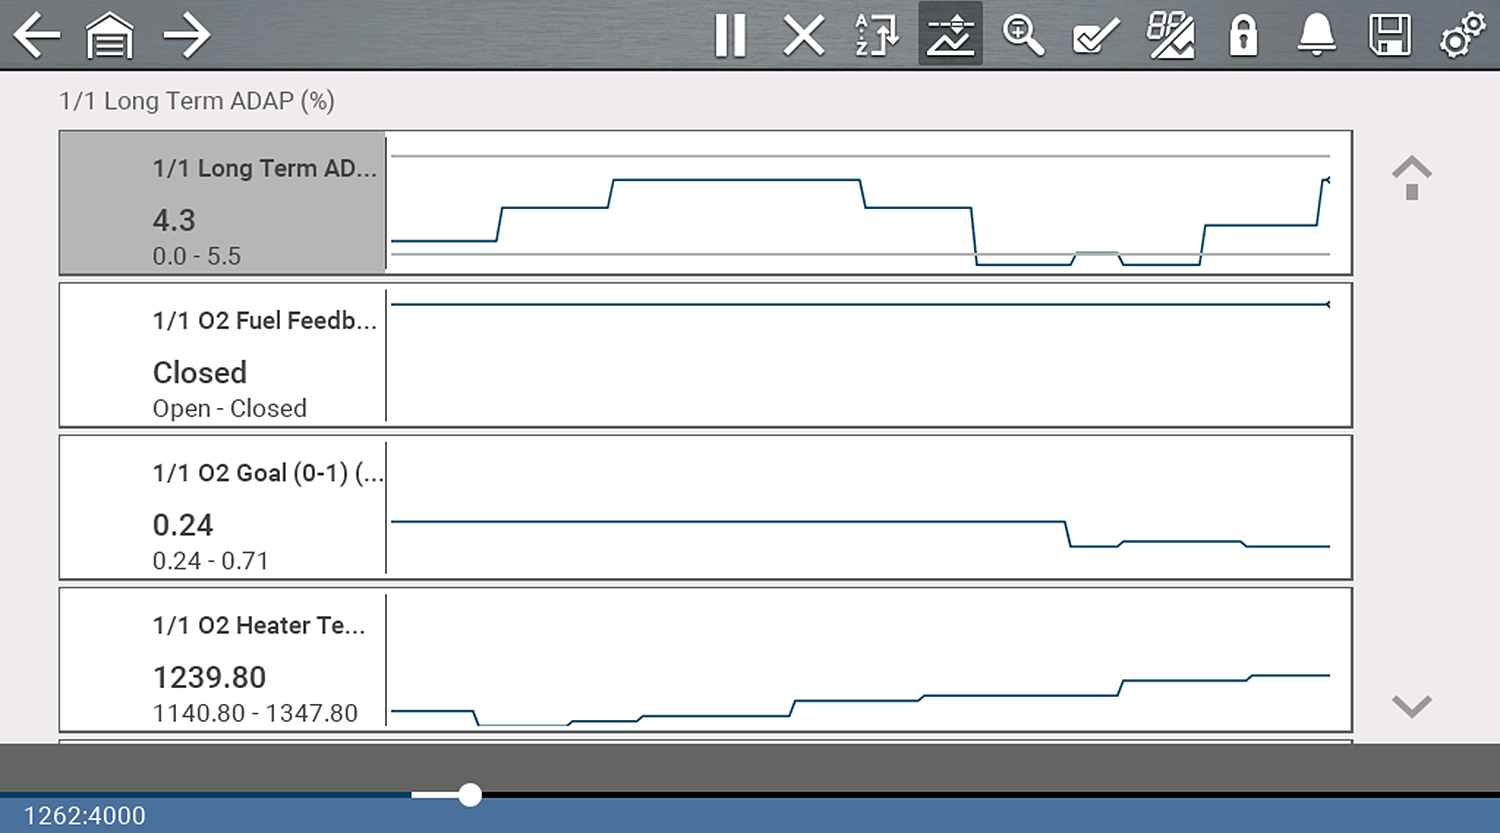
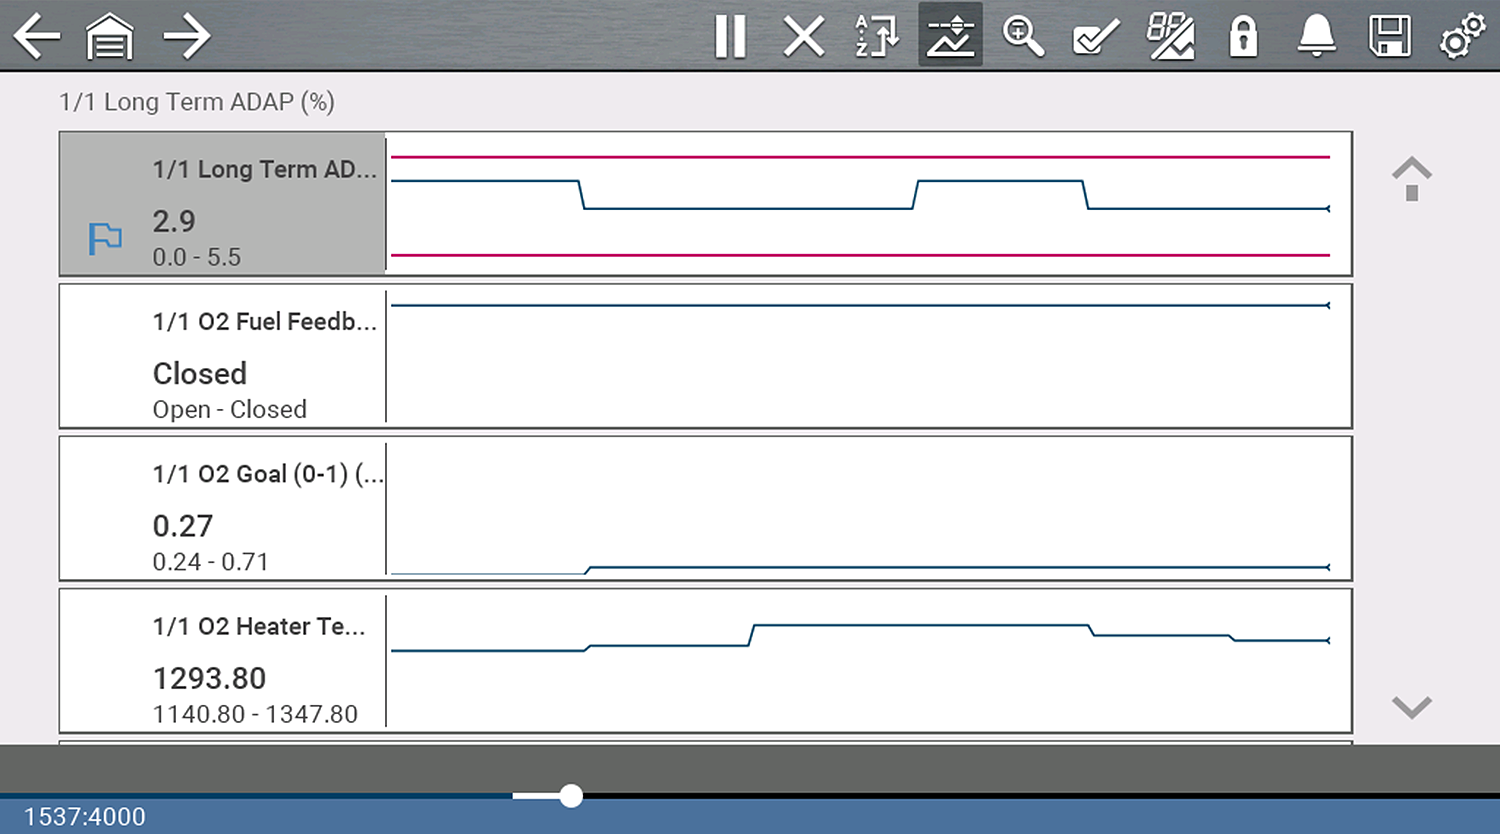
Examples of the following trigger states (Armed / Not Activated - upper image) and (Activated - lower image) are shown below .
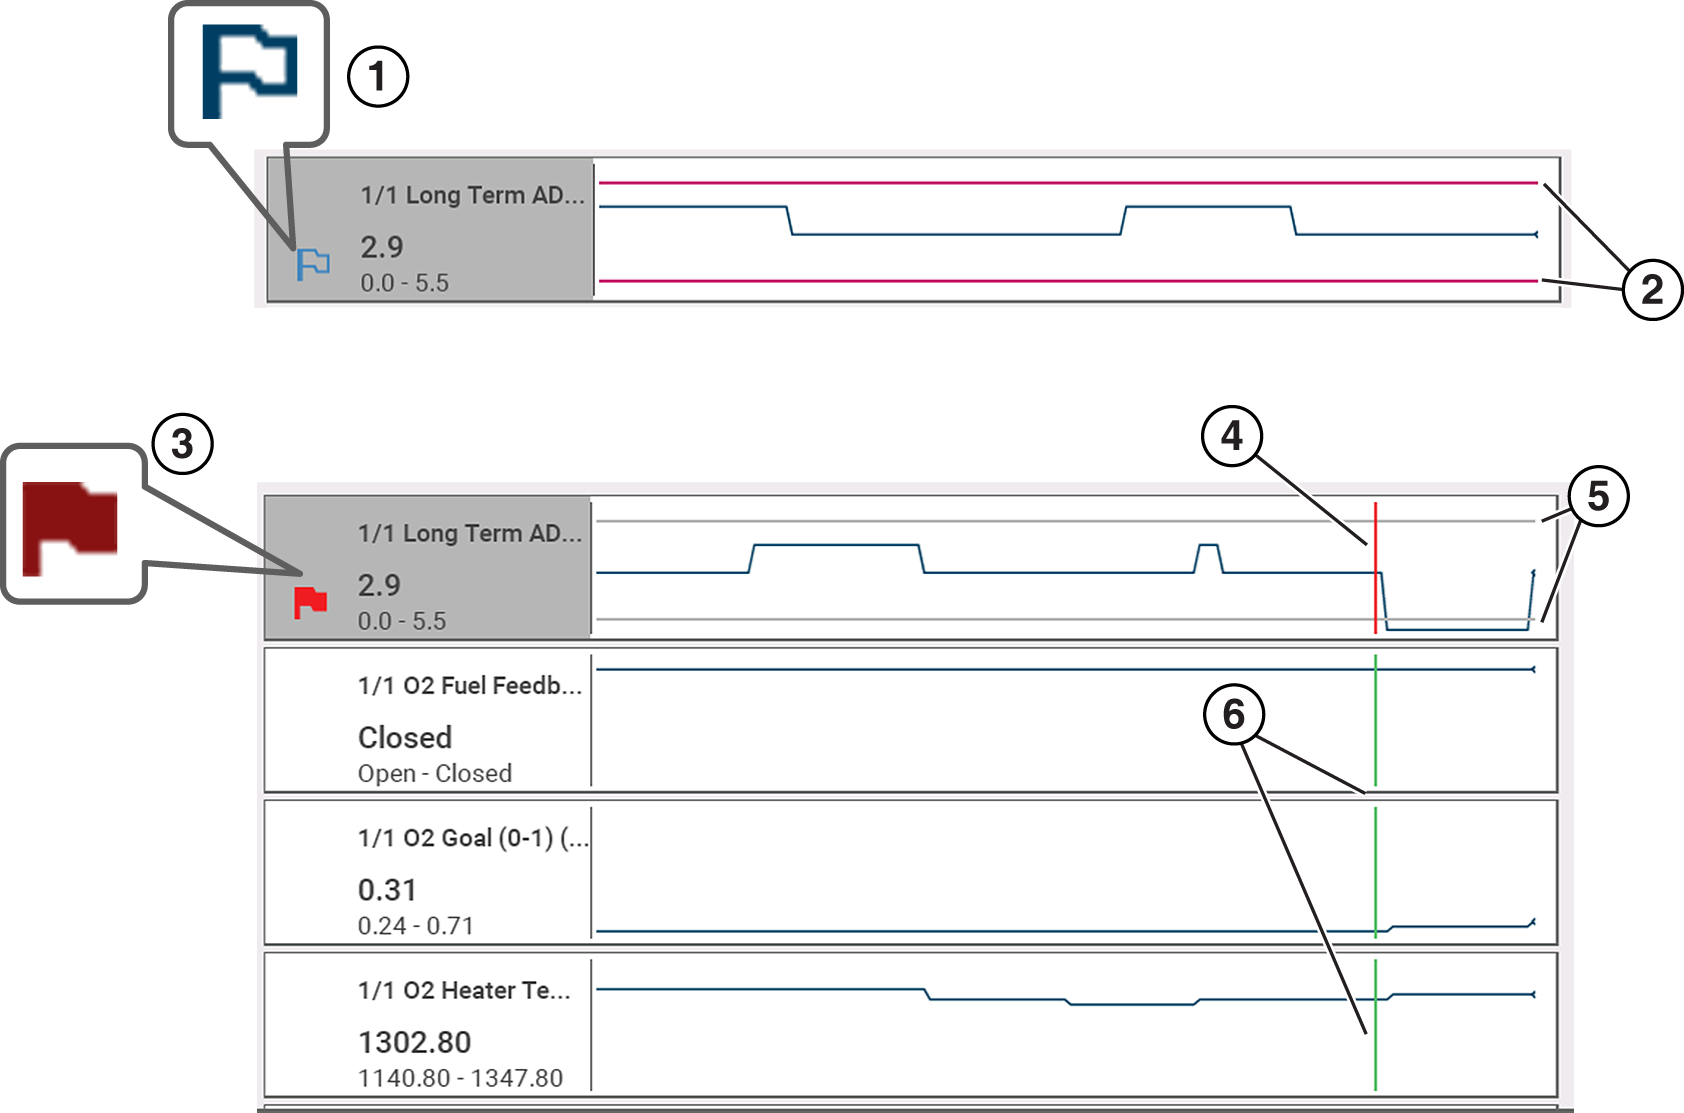
| 1. | Armed PID Trigger Indicator - A blue outlined flag indicates the PID trigger is armed. |
| 2. | Upper and Lower Limit Lines (Armed) - Colored limit lines indicate the trigger is armed but not activated. |
| 3. | Activated PID Trigger Indicator - A red flag indicates the PID trigger has activated. |
| 4. | Trigger Activation Point Cursor - A red cursor line is displayed in the PID data where the trigger was activated. |
| 5. | Upper and Lower Limit Lines (Not Armed and Activated) - Gray limit lines are displayed when the trigger is armed but not activated and after the trigger has been activated. |
| 6. | Trigger Activation Point Reference Cursor - Green cursors lines are displayed on all the other PID graphs to indicate their relationship to where the trigger occurred. |
PID Trigger Status Icons
The icons (below) are used to help you quickly identify the status of individual PID triggers:
|
Icon |
Description |
|
Trigger Armed |
Trigger has been set (configured) and is armed. |
|
|
|
|
Trigger Activated |
Trigger has been activated (upper or lower limit has been met). |
|
|


To use triggers, they must be turned on (set/configured), and then armed. Use the following procedures to setup PID triggers.
| 1. | Highlight the PID to setup with a trigger. |
| 2. | Select the Trigger icon. |
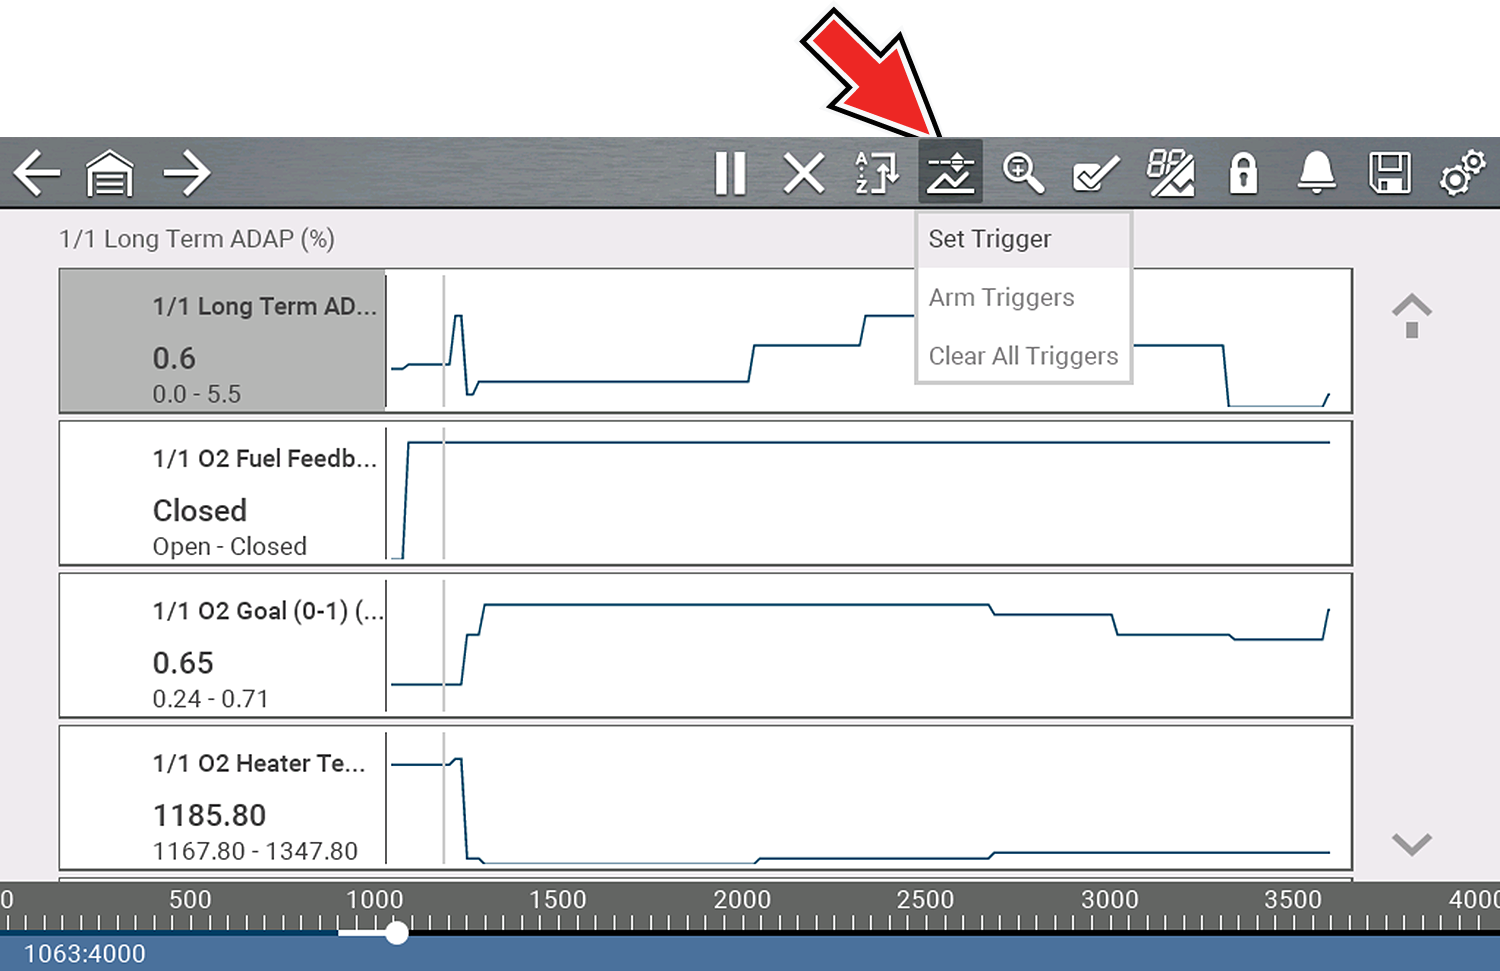
Selecting the Trigger icon displays trigger menu options:
| - | Set Trigger—opens setup screen for upper/lower limits (trigger points) |
| - | Arm Trigger—arms the trigger to capture data |
| - | Clear All Triggers—deletes all previously set triggers |
If triggers are already set, the menu options are:
| - | Clear Trigger—deletes the highlighted trigger |
| - | Disarm Trigger—disarms the highlighted trigger |
| - | Clear All Triggers—deletes all set triggers |
| 3. | Select Set Trigger. |
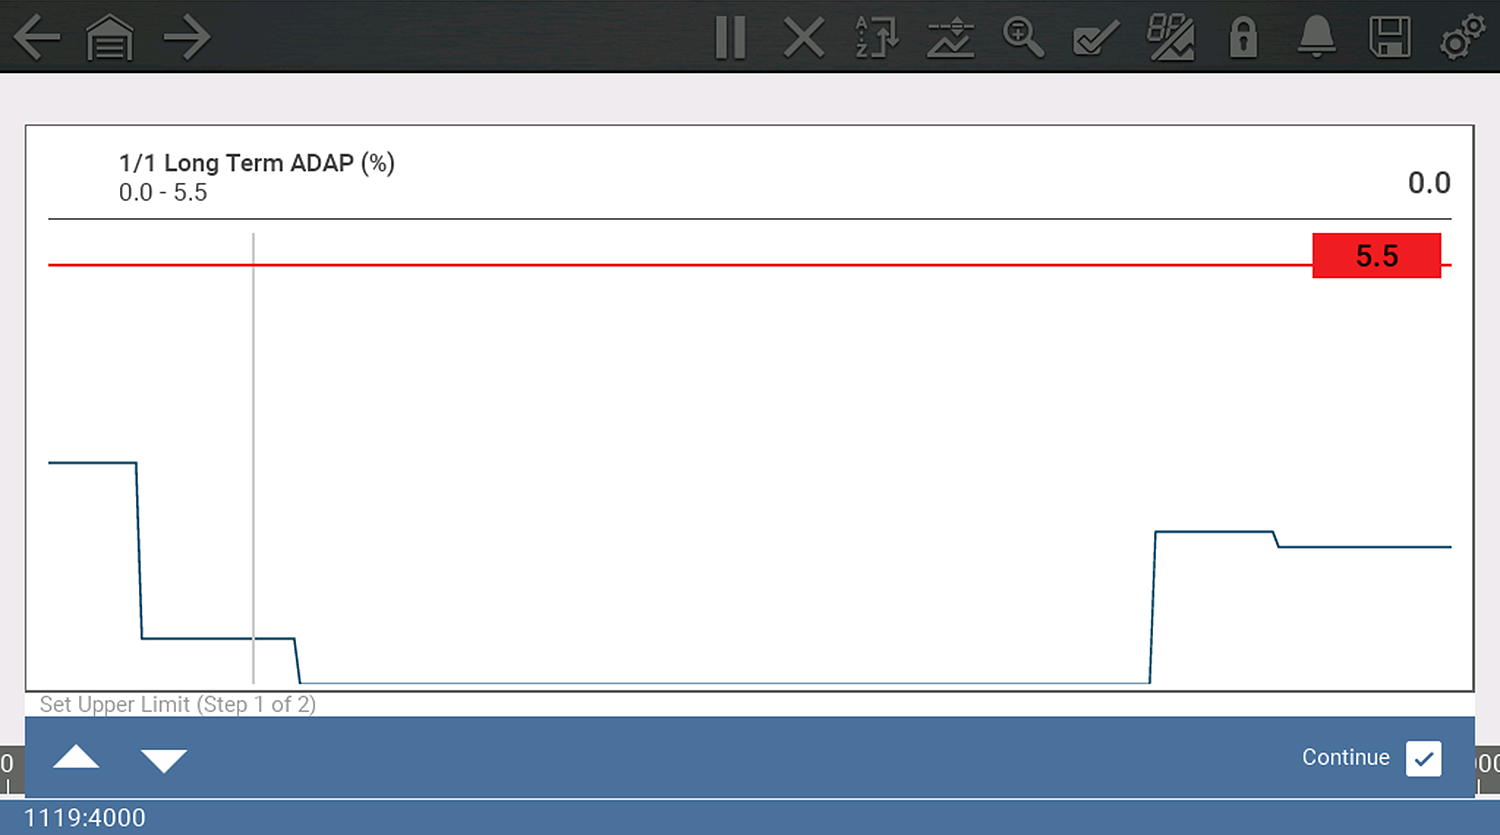
A graph of the highlighted PID and setup icons display.
The upper trigger point must be set first. A red horizontal line is displayed across the data graph representing the upper trigger point.
| 4. | Use the lower toolbar arrow icons , or the up b and down d arrow buttons to change the position of the upper trigger point. |
| 5. | Select a, or press the Y button, to set the upper trigger point. |
The upper trigger line changes color to gray and the lower trigger line displays in red .
| 6. | Change the position of the lower trigger line in the same manner as the upper. |
| 7. | When finished, select a, or press the Y button, to set the lower trigger level. |
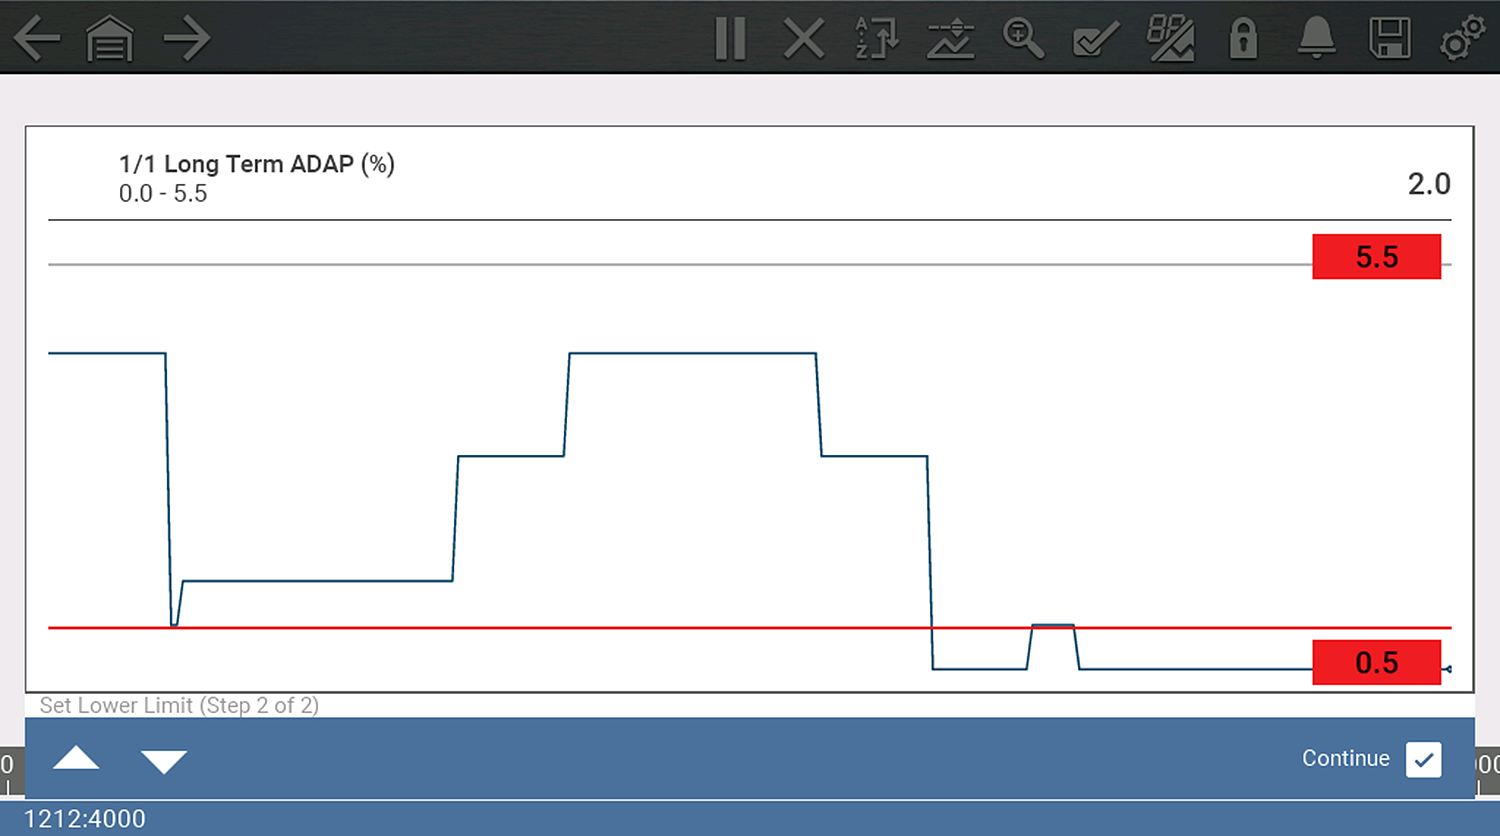
The display returns to the PID data view and the trigger points appear as horizontal lines across the designated graph . Repeat this procedure to establish trigger points for other parameters (up to three) if desired.
Only three parameters can have trigger levels set at one time, but only one of the conditions needs to be satisfied for triggering to occur.
► Arming triggers:
| 1. | Select the Trigger icon. |
| 2. | Select Arm Triggers. |
The trigger point lines change color to indicate an armed condition.
All set PID triggers are armed simultaneously (if more that one is set). Once armed it remains armed until you clear it or the trigger is activated.
About Activated Triggers
A trigger is activated (displays red flag)  when a PID value meets an upper/lower limit (trigger point).
When a trigger is activated:
| ● | Data collection is briefly paused as the Scanner captures a short recording of PID data (before and after the trigger event), and saves it as a data file. |
| ● | A gray cursor line is displayed to indicate the point at which the data was paused or saved. |
| ● | An audible alarm is sounded |
| ● | A message displays indicating a data file was saved. |
| ● | Data collection continues. |
| ● | The activated PID trigger is disarmed. Note - if a different PID trigger is activated subsequently, an additional data file will be recorded. |
| ● | A red cursor line is displayed on the graph of the PID with the activated trigger to indicate where the trigger occurred. A green cursor line is displayed on all the other PID graphs to indicate their relationship to where the trigger occurred. |
| ● | The trigger menu options are: |
| - | Clear Trigger—deletes the highlighted trigger |
| - | Arm Trigger—arms the trigger to capture data |
| - | Clear All Triggers—deletes all set triggers |