The scope/meter screens typically include the following sections:
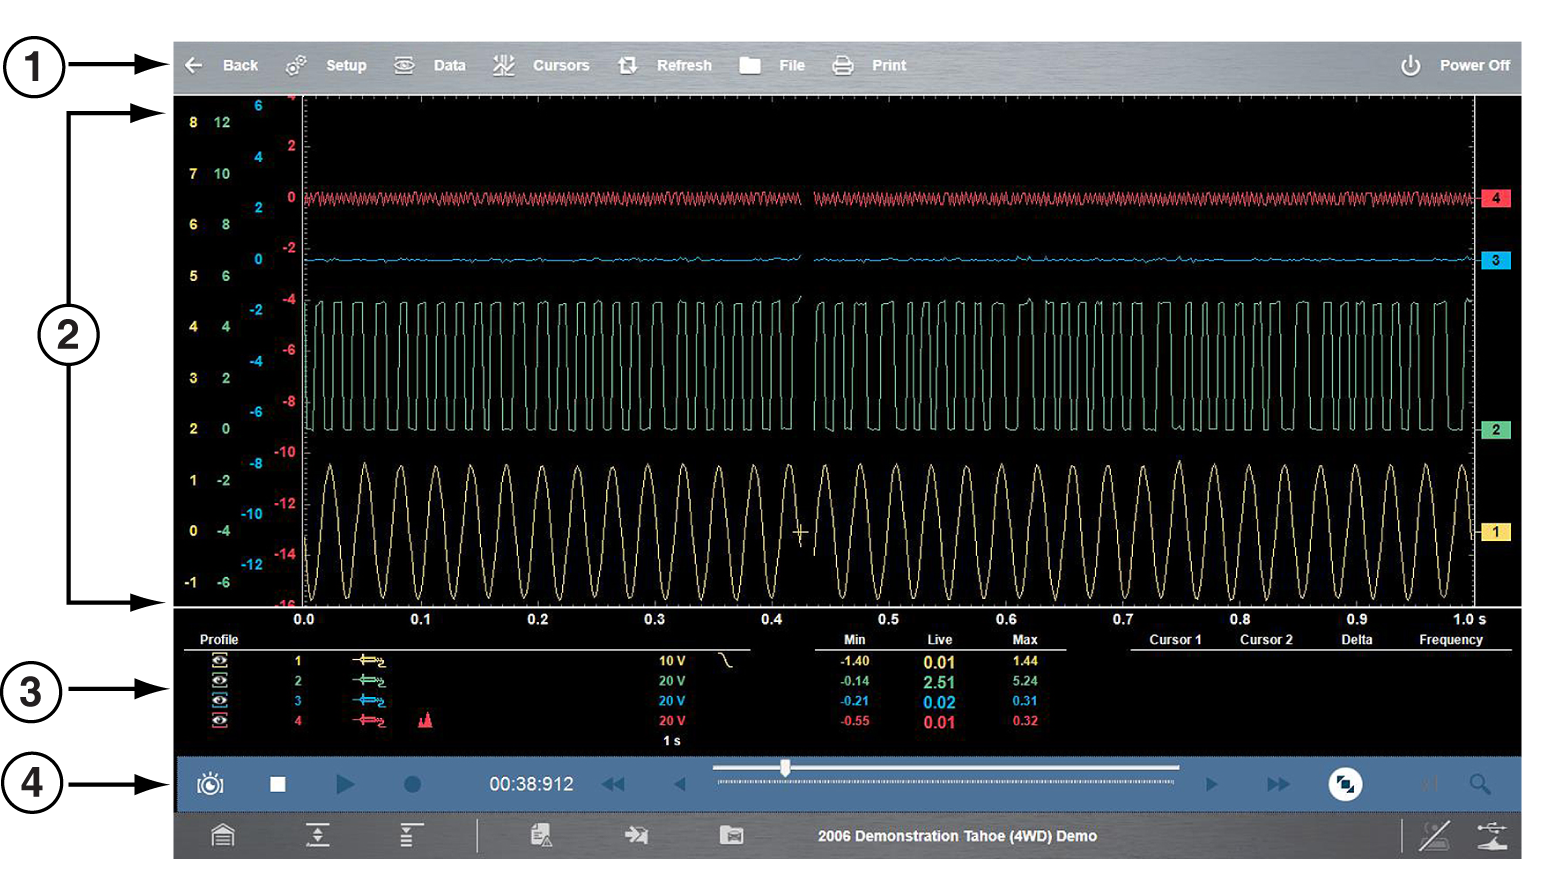
Scope Multimeter screen layout
| 1. | Scope/Meter Toolbar - contains various navigational, and control icons |
| 2. | Main Body - contains the meter/scope display |
| 3. | Control Panel - contains channel/trace controls Control Panel and Settings |
| 4. | Lower Toolbar - includes icons to navigate through paused data |
Scope/Meter (Upper) Toolbar
The Scope/Meter toolbar is used to set up the tool for testing and to configure the settings for each trace. The following table provides brief descriptions of the control icons on the toolbar:
|
Name |
Icon |
Description |
|
Back |
|
Returns to the previously viewed screen. |
|
Setup |
|
|
|
Data |
|
Switches the display between three states. See Display Modes. |
|
Cursors |
|
See Cursors |
|
Refresh |
|
Clears the minimum, maximum and live measurements displayed. Uses: Track the variation in a component or circuit under a certain condition. If the condition changes, Refresh lets you start tracking again to see the change. Verify that a connection problem you found by looking for a dropout or spike in min/max values has been fixed. |
|
File |
|
Allows you to select options for saving data. See Saving Data |
|
|
|
Opens a standard Windows Print dialog box that allows you to configure and print data. See Printing / Printer Setup.. |
|
Power Off |
|
Switches the Scope Multimeter off. This retains the settings and reduces battery drain when switching to a different module. The Play and Record icons on the toolbar can be used to switch the meter back on. |

Main Body of the Screen
The main body of the screen varies depending on what display options have been selected. Up to four traces, along with digital readouts of current signal values, signal status and triggering conditions, can be displayed simultaneously on the main body of the screen. Adjustments to the display are made through the scope toolbar as explained above.
Each trace is displayed as voltage over time on a standard oscilloscope screen. Voltage level is recorded on the vertical, or “y-axis” and time is presented on the horizontal, or “x-axis” of the screen. Values are shown for each graduation on the scales.
When using transducers, the pressure being sensed by the transducer is converted into a voltage signal. However, the values are shown as pressure on the display screen rather than voltage.