Data (Viewing PIDs)
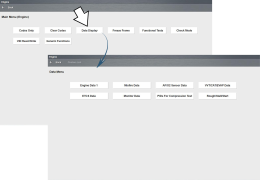
From the main system menu (in Scanner) select Data to view PIDs for the selected
module. The Data display is typically opened from the Vehicle Systems Test/Function menu, see Selecting a Vehicle System Test/Function. The descriptive name may vary (e.g. Data, Data Display, Data Menu, Data Only, or other similar).
|
Getting Started Videos
|
Scanner Data Overview - Part 1
Opens in a new tab.
|
|

|
Scanner Data Overview - Part 2
Opens in a new tab.
|
Selecting Data may result in one of the following:
|
●
|
A submenu of data viewing options opens. |
On some models, the engine must be started or cranked before data can be displayed. For these models, a “Waiting to Communicate” message displays if the engine was not cranked or started.
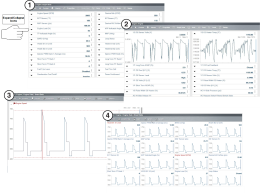
 Data Screen Overview
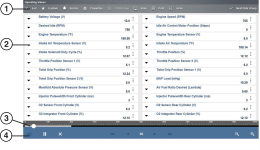
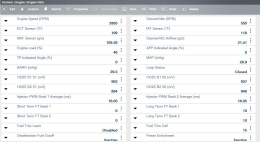
Typical data screen (List / text) layout shown
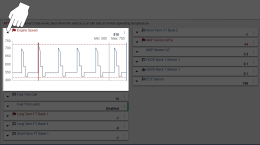
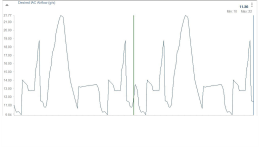
Select the Expand/Collapse icon to toggle a PID between list and graph views (see images below).
Selecting the Expand/Collapse icon when in list view, opens the PID in graph view, and moves that PID to the top of the list.
Typical PID (list view)
|
-
|
Full Screen View - expands the graph to fill the entire screen
|
|
-
|
Setup - opens graph scale and trigger settings
|
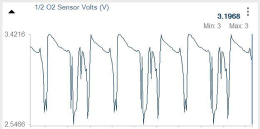
Typical PID (graph view)
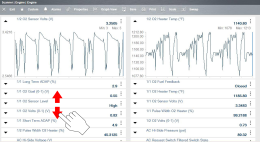
Use gesture scrolling (up/down) to quickly move through each data list.
Data Display Options
PIDs can be displayed in different views.
 List View
List View is the default view mode and displays all PIDs in list (text) format.
 Split View
To view one or more PIDs as a graph from the list view, select the Expand/Collapse icon. To return the PID to list view, select the icon again.
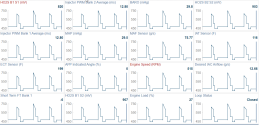
 Multi-Graph View
To view more than one PID in a multi-graph display, select the PID Expand/Collapse icon to open each PID in graph display you want to include, then select Graph View from the toolbar. To return to list view, select List View from the toolbar.
 Full Screen Single Graph View
To view a single PID graph in full screen, select the PID Expand/Collapse icon to open the PID in graph display, then select Graph View from the toolbar, or select the Menu icon  and then select Full Screen Graph.
To exit full screen, select List View from the toolbar, or select the Menu icon, and then select Normal Graph.
 and then select Full Screen Graph.