This section provides a general overview of all the trace setting control features used across all Scope Multimeter functions.
The control panel is common to all three Scope Multimeter functions, and contains the trace (or “channel”) controls that are used to monitor and adjust the signal being measured.
The trace control icons within the Control Panel open the same control setup menus as are available from the Trace Setup menu.
Adjustments are made by selecting the item to be changed on the touch screen. A dash (–) indicates a function that is not selected, and an icon indicates an active function.
The information in the following sections is intended as a guide and general overview of the controls and functions used within the Scope Multimeter. Not all the settings or controls described throughout this section are applicable with all functions, some may be “grayed out” or not active (applicable), depending on the function or test.
The control panel has three display modes, and can be changed by repeatedly selecting the Expand/Collapse icons  from the lower toolbar, or the Data icon on the upper toolbar.
| ● | Normal —control setting icons are displayed (e.g. Profile, Channel, Probe, Filter, Scale, etc) |
| ● | Expanded—a limited set of control settings are displayed and the Min. Max. Live and Cursors panels are displayed |
| ● | Control Panel Off— the control panel is not displayed, only the meter screen is shown |
Trace (channel) settings and controls can be accessed in the Control Panel and the Trace Setup menu. Graphic and value icons are used in the control panel to access the settings. Applicable settings are displayed depending on the test.
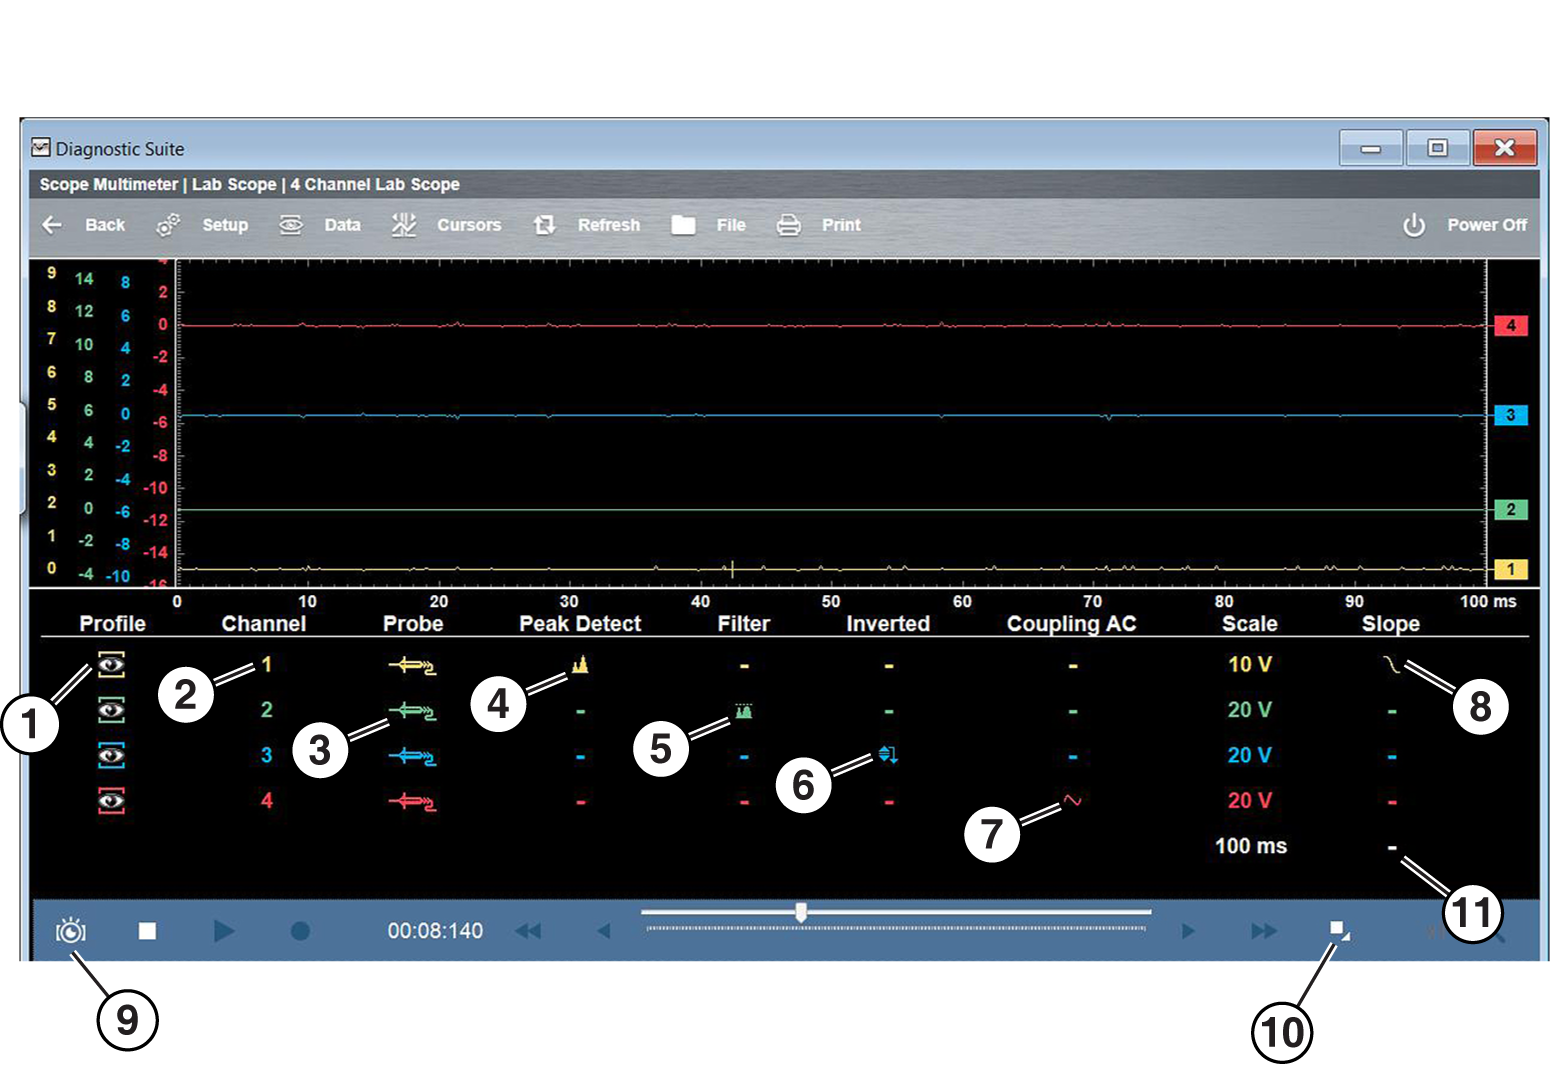
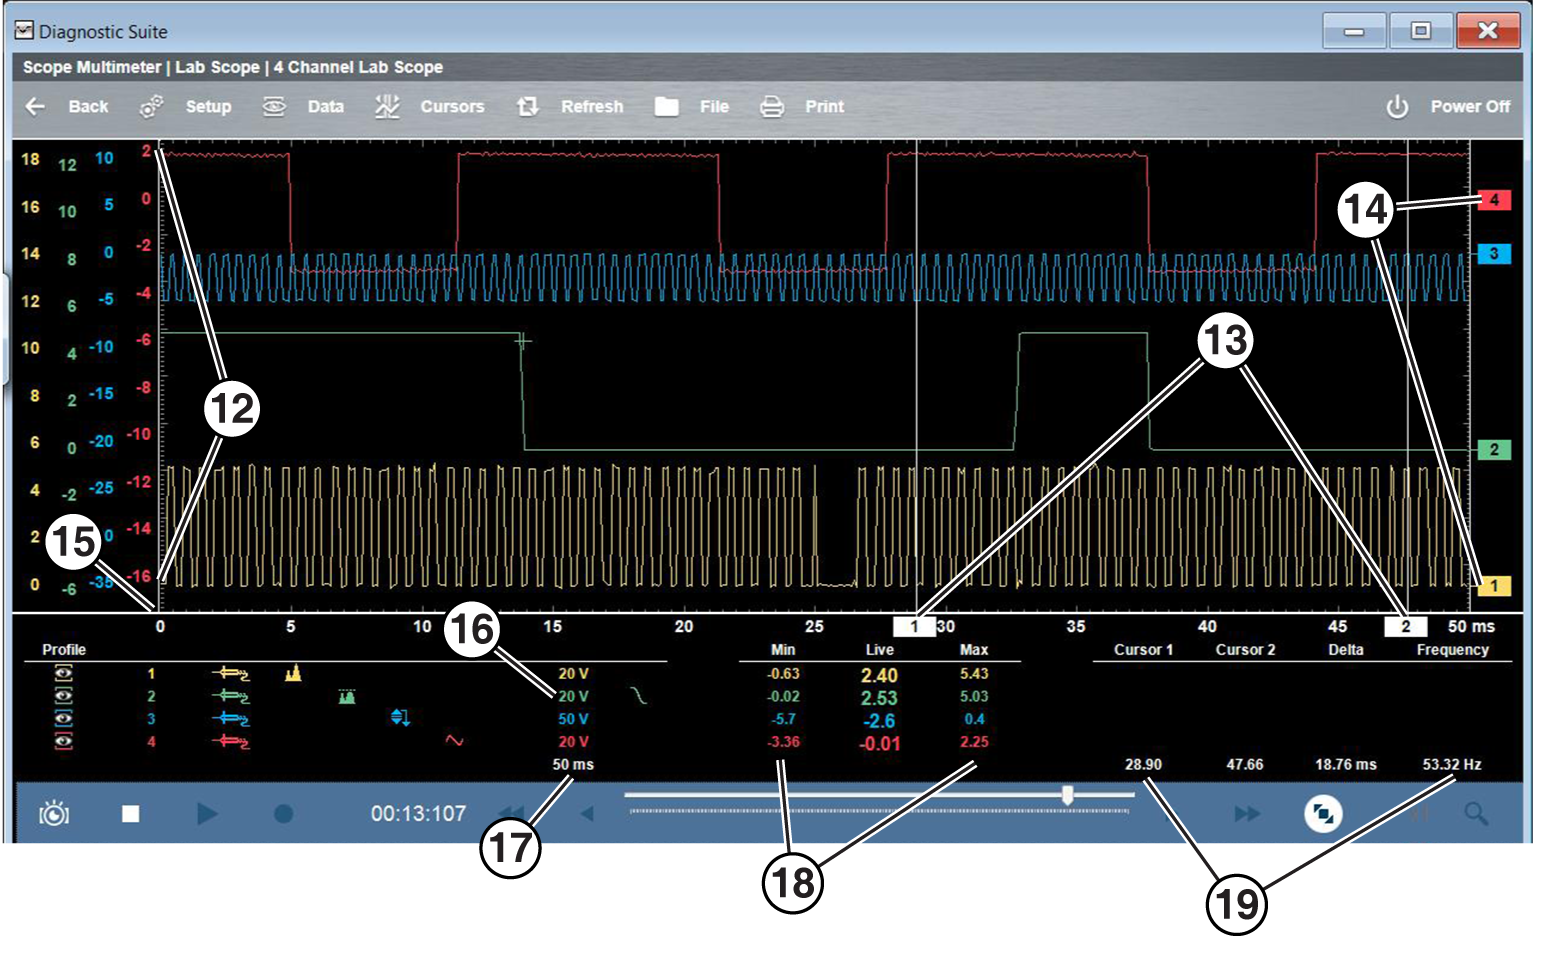
Various control icons are shown in the following images.
| 1. | Profile Icon |
| 2. | Channel Icon |
| 3. | Probe Icon |
| 4. | Peak Detect Icon |
| 5. | Filter Icon |
| 6. | Invert Icon |
| 7. | Coupling AC Icon |
| 8. | Slope (Trigger) Icon |
| 9. | Taking a Data Snapshot |
| 10. | Expand/Collapse Icon |
| 11. | Trigger Setup Menu Icon |
| 1. | Scale (Vertical / Y-axis) |
| 2. | Cursor Indicators |
| 3. | Zero Baseline Indicators |
| 4. | Sweep Scale (X-axis) |
| 5. | Channel Scale Indicator Icons |
| 6. | Sweep Indicator Icon |
| 7. | Min, Live and Max Display Panel |
| 8. | Cursor Control Panel |
The Profile icons (variable) allow you to hide or display channels onscreen.
Selecting an icon turns a channel on and off.
|
Profile Icons (Typical) |
|
|
On (Channel displayed) |
Off (Channel not displayed) |
|
|
|
The Channel icons (variable) identify the channel numbers (1 to 4). Selecting an icon opens the trace setup menu. See Trace Controls Menu.
|
Channel Icon (Typical) |
|
|
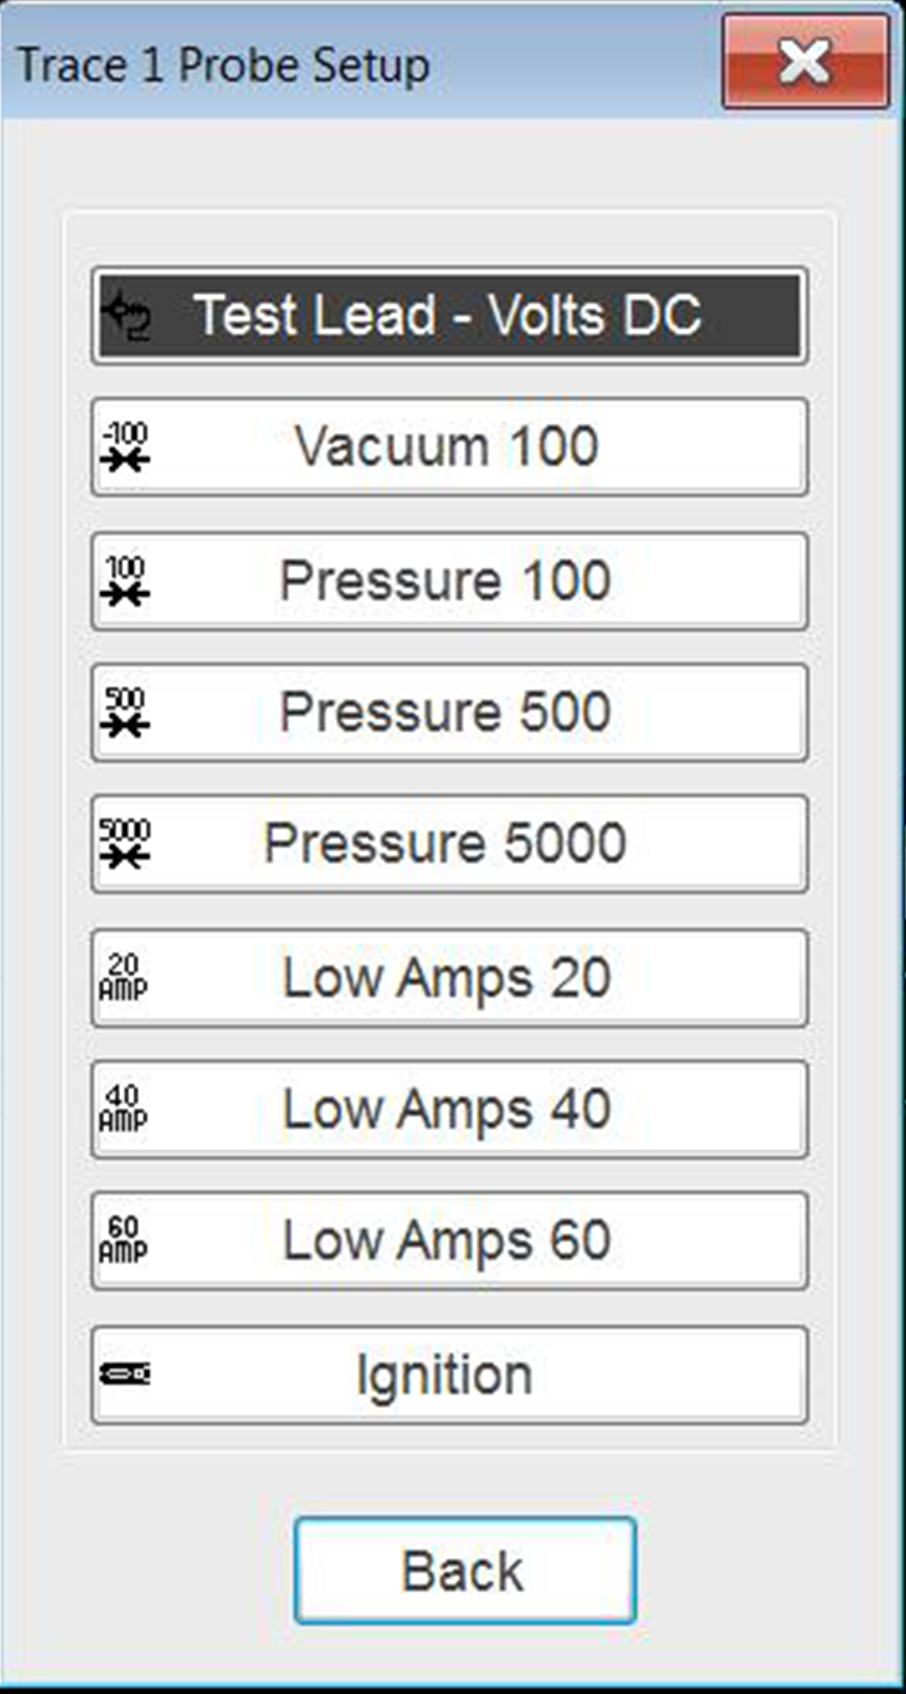
The Probe icons (variable) ![]() allows you to change the type of probe for the test you are performing. Selecting an icon opens the probe setup menu. Changing the probe, also changes the vertical scale to the applicable type of measurement.
allows you to change the type of probe for the test you are performing. Selecting an icon opens the probe setup menu. Changing the probe, also changes the vertical scale to the applicable type of measurement.
For probe calibration information, see Test Lead / Probe Calibration.
Probe option menu
|
Probe “test” Options |
|
|
Menu Option |
Probe / Device Used |
|
Test Lead - Volts DC |
Standard Channels 1 to 4 test leads with alligator clips or test probes |
|
Vacuum 100 |
(optional) 0-100 psi pressure transducer with pressure adapter |
|
Pressure 100 |
|
|
Pressure 500 |
(optional) 0-500 psi pressure transducer with pressure adapter |
|
Pressure 5000 |
(optional) 0-5000 psi pressure transducer with pressure adapter |
|
Low Amps 20 |
(optional) Low Amp Probe |
|
Low Amps 40 |
|
|
Low Amps 60 |
|
|
Ignition |
(optional) Secondary ignition adapter lead with desired secondary ignition coil adapter |
Peak Detect allows you to maximize the signal sampling rate in order to capture fast events, such as spikes, glitches and other anomalies, that may normally be undetected.
|
Peak Detect Icons (Typical) |
|
|
On (Sampling maximized) |
Off (Sampling not maximized) |
|
|
|
Peak Detect Off
When peak detect is off, the scope samples at a high rate but saves just enough sample points to the data buffer memory to plot a waveform across the screen. No preference is given to any point during the selection process.
— Turning peak detect “off” is suitable for basic measurements, and viewing waveforms (e.g. oxygen (O2) or Cam sensor) when capturing fast events is not necessary.
— The longer the time sweep, the greater the chance a glitch could be missed because it occurred in between the sample points saved to the data buffer memory. To increase the chance of capturing a glitch with peak detect “off”, a shorter time sweep should be selected.
— Turning peak detect “off” avoids the need for an external filter to decrease the display of unwanted noise, which can make diagnosis more difficult.
Example: With a time sweep of 10 seconds on a screen 100 points wide, the effective sample rate would be 10 times a second. Decreasing the time sweep to 1 second, increases the effective sample rate to 100 times a second. At this time setting, a fast occurring event is more likely to be captured due to the increased rate. This is the standard mode of operation for many scopes.
Peak Detect On
When peak detect is “on”, all sample points are evaluated. The points stored to the data buffer memory are intelligently selected to capture fast events that might be missed at slower effective sample rates. Peak Detect captures fast events, spikes and glitches for signals going in both positive and negative directions.
— Turn peak detect "on" when capturing fast events (e.g. ignition firing voltage, glitches, and intermittent events).
— Turning peak detect “on” may capture unwanted noise, therefore, using peak detect may not be suitable for some tests (e.g. oxygen (O2) sensor), as the waveform may be more difficult to evaluate due to the additional noise that may be displayed.
— Peak Detect decreases the possibility of waveform aliasing.
Depending on which function it is used with, Filter can minimize or smooth out signal spikes and fast variations, when the signal is disrupted by noise or other interference.
|
Filter Icons |
|
|
On (Interference is suppressed) |
Off (Interference is not suppressed) |
|
|
|
Filter - Lab Scope
Using the filter with the lab scope, smooths out fast spikes, which helps to provide a good balance between noise suppression and signal integrity.
Using the filter is useful when working with scales of 5 volts and below, as the lower the voltage scale, the more likely noise can occur.
Example:Using the filter is helpful when testing components such as, an O2 sensor (1or 2 volt scale), or when performing a throttle position (TP) sensor sweep test (5 volt scale).
In addition, the filter is also helpful for low amp probe tests, as a low voltage scale is used to measure the output of the probe (due to the conversion factors of the probe).
Example:For a probe with a conversion factor of 100 mV/A connected to a 2 amp load, the scope uses a 200 mV scale to measure the output of the probe. The scope converts the measured output to 2 amps for display on the screen.
Filter - GMM
Using the filter with the GMM minimizes noise by ignoring or smoothing out fast signal spikes.
| ● | For a direct measurement test, such as volts, amps, or pressure, the filter minimizes the display of very fast spikes by averaging the sampled data when filter is active. |
| ● | For a calculated measurement test, such as frequency, pulse width, dwell, or duty cycle, extremely fast spikes (20 µS and faster) from sources like the ignition system are ignored when filter is active. |
Invert is used to switch signal polarity, so the trace appears upside down (inverted) on the screen. This is typically used when measuring amperage using the low amp probe, or high-voltage signals like secondary ignition.
|
Invert Icons |
|
|
On (Polarity is inverted) |
Off (Polarity is not inverted) |
|
|
|
Example: A signal that normally rises from 0 to +5 volts, if inverted would show falling from 0 to –5 volts.
Coupling AC subtracts the average value of a signal so that small variations can be seen in the waveform. This is accomplished by blocking the direct current (DC) portions of a signal in order to amplify (show) the alternating current (AC) portions of the signal, without driving the trace off of the screen.
Using coupling AC can be helpful when testing and diagnosing alternator ripple or fuel pump amperage, by allowing you to see any abnormal small variations or events.
|
Coupling AC Icons |
|
|
On (DC signal portion blocked) |
Off (DC signal portion not blocked) |
|
|
|
See Triggers are only available in the lab scope function. for additional information.
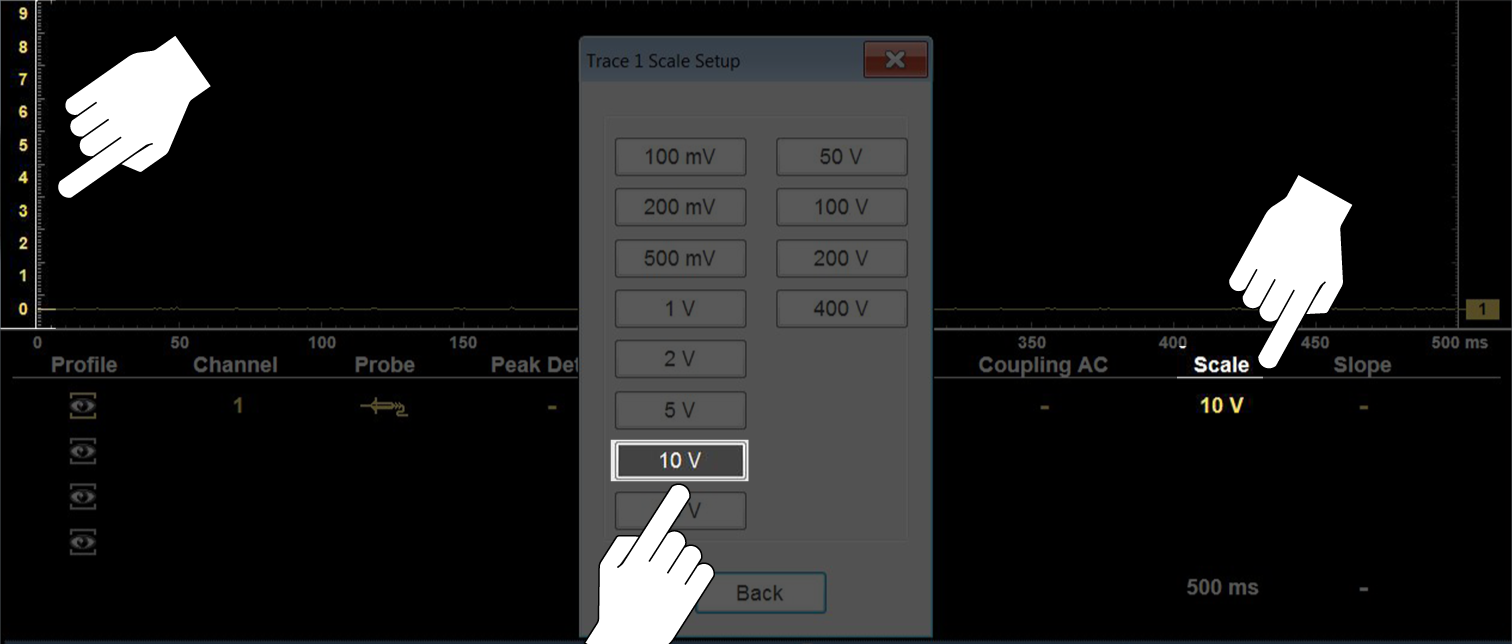
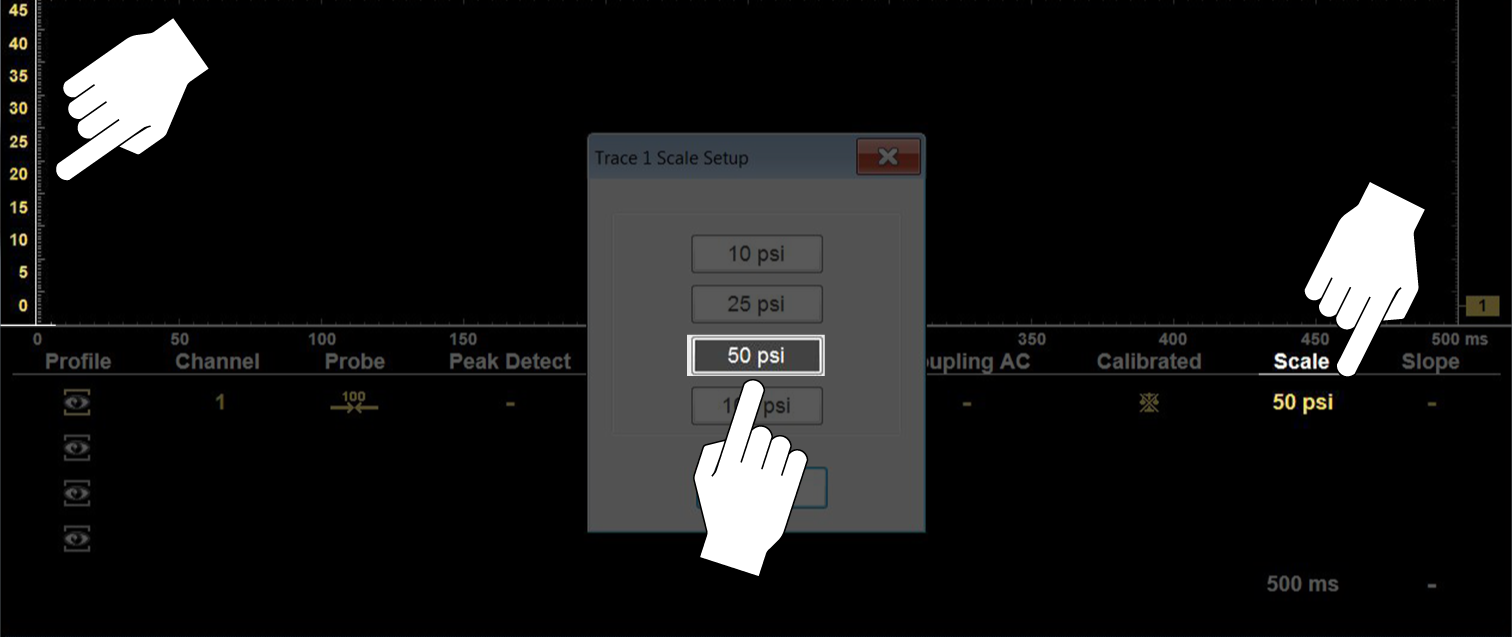
The vertical scale (Y-axis) represents what is being measured (voltage, amperage, pressure etc.), and the unit of measurement it is being measured in. The vertical scale is “always” divided into10 major divisions; how these divisions are defined, sets the scale of measurement.
Vertical scales (any channel) can be set independently.
To adjust the vertical scale unit of measurement, select the Vertical Scale icon to open the vertical scale menu. The value displayed in the vertical scale icon indicates the active value. Adjustment can also be made using the Trace Controls menu, see Trace Controls Menu.
Example:Selecting 10V, changes the vertical scale to a 10V volt scale. The scale is “always” divided by 10, therefore each division is incremented by 1V.
Example: Selecting 50 psi displays a 50 psi scale that is divided by 10, therefore each division is incremented by 5 psi.
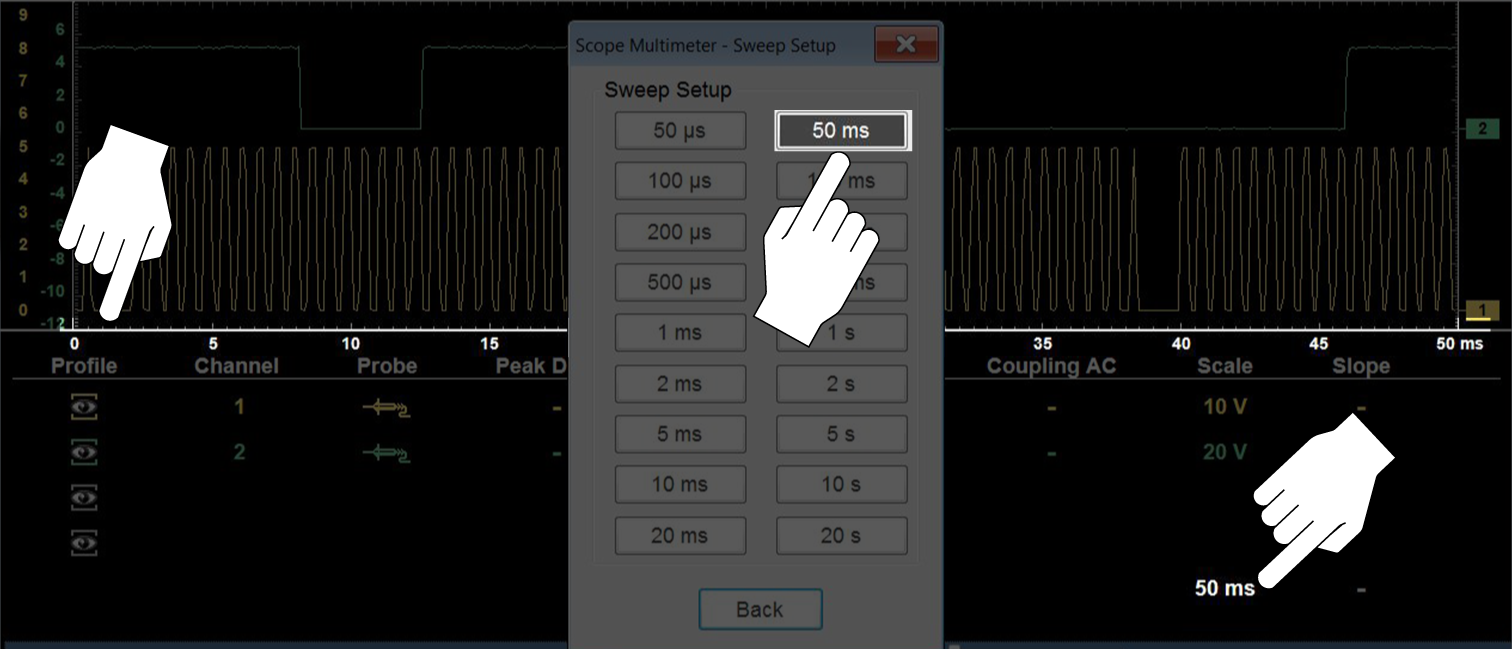
The Sweep Scale or horizontal scale (X-axis) represents time, and the unit of measurement it is being measured in. The horizontal scale is “always” divided into10 major divisions. How these divisions are defined sets the scale of measurement. The value displayed in the sweep Scale icon indicates the active sweep setting.
The sweep setting applies to all channels and cannot be set independently per channel.
To adjust the sweep scale, select the Sweep Scale icon from the Control Panel to open the sweep scale menu. The value displayed in the Sweep Scale icon (white color) indicates the active value.
Adjustment can also be made using the Trace Controls menu, see Trace Controls Menu.
Example:Selecting 50ms, changes the sweep scale to a 50ms scale. The scale is “always” divided by 10, therefore each division is incremented by 5ms.
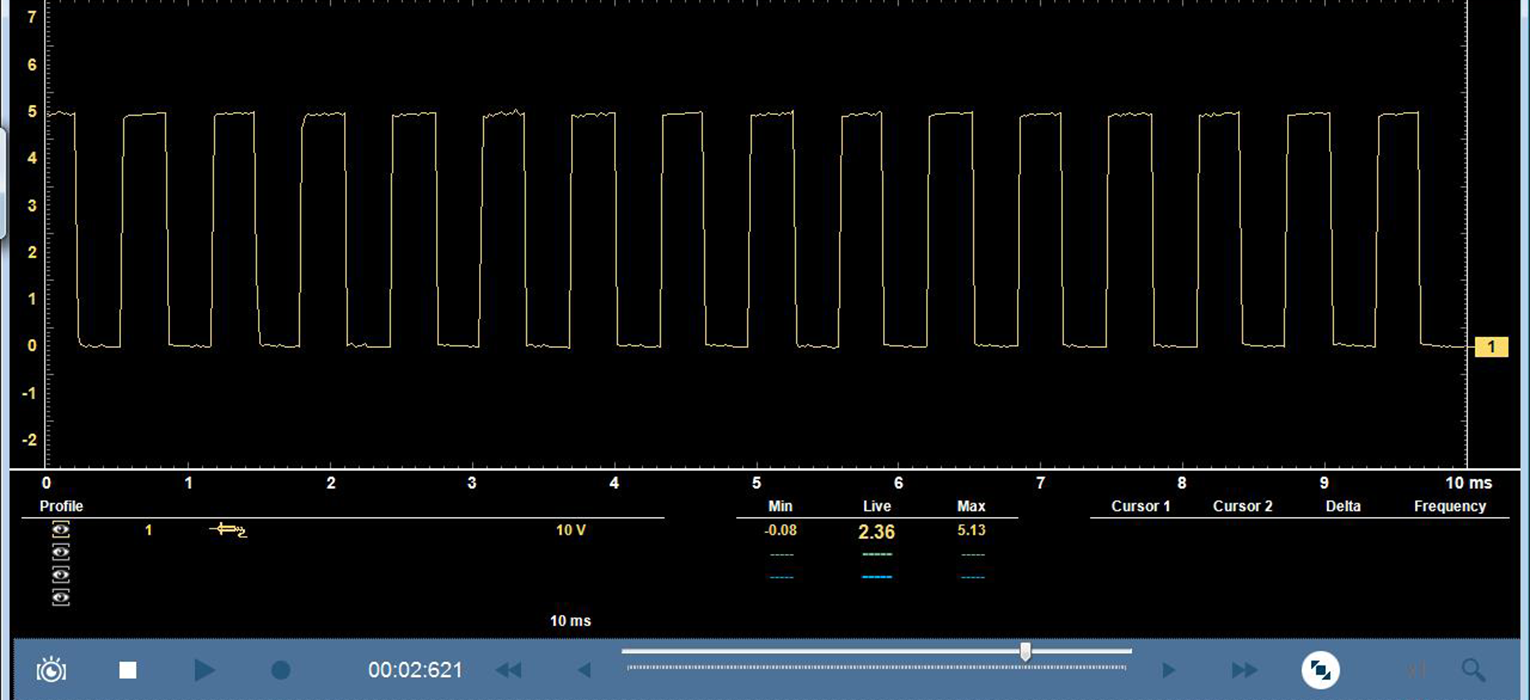
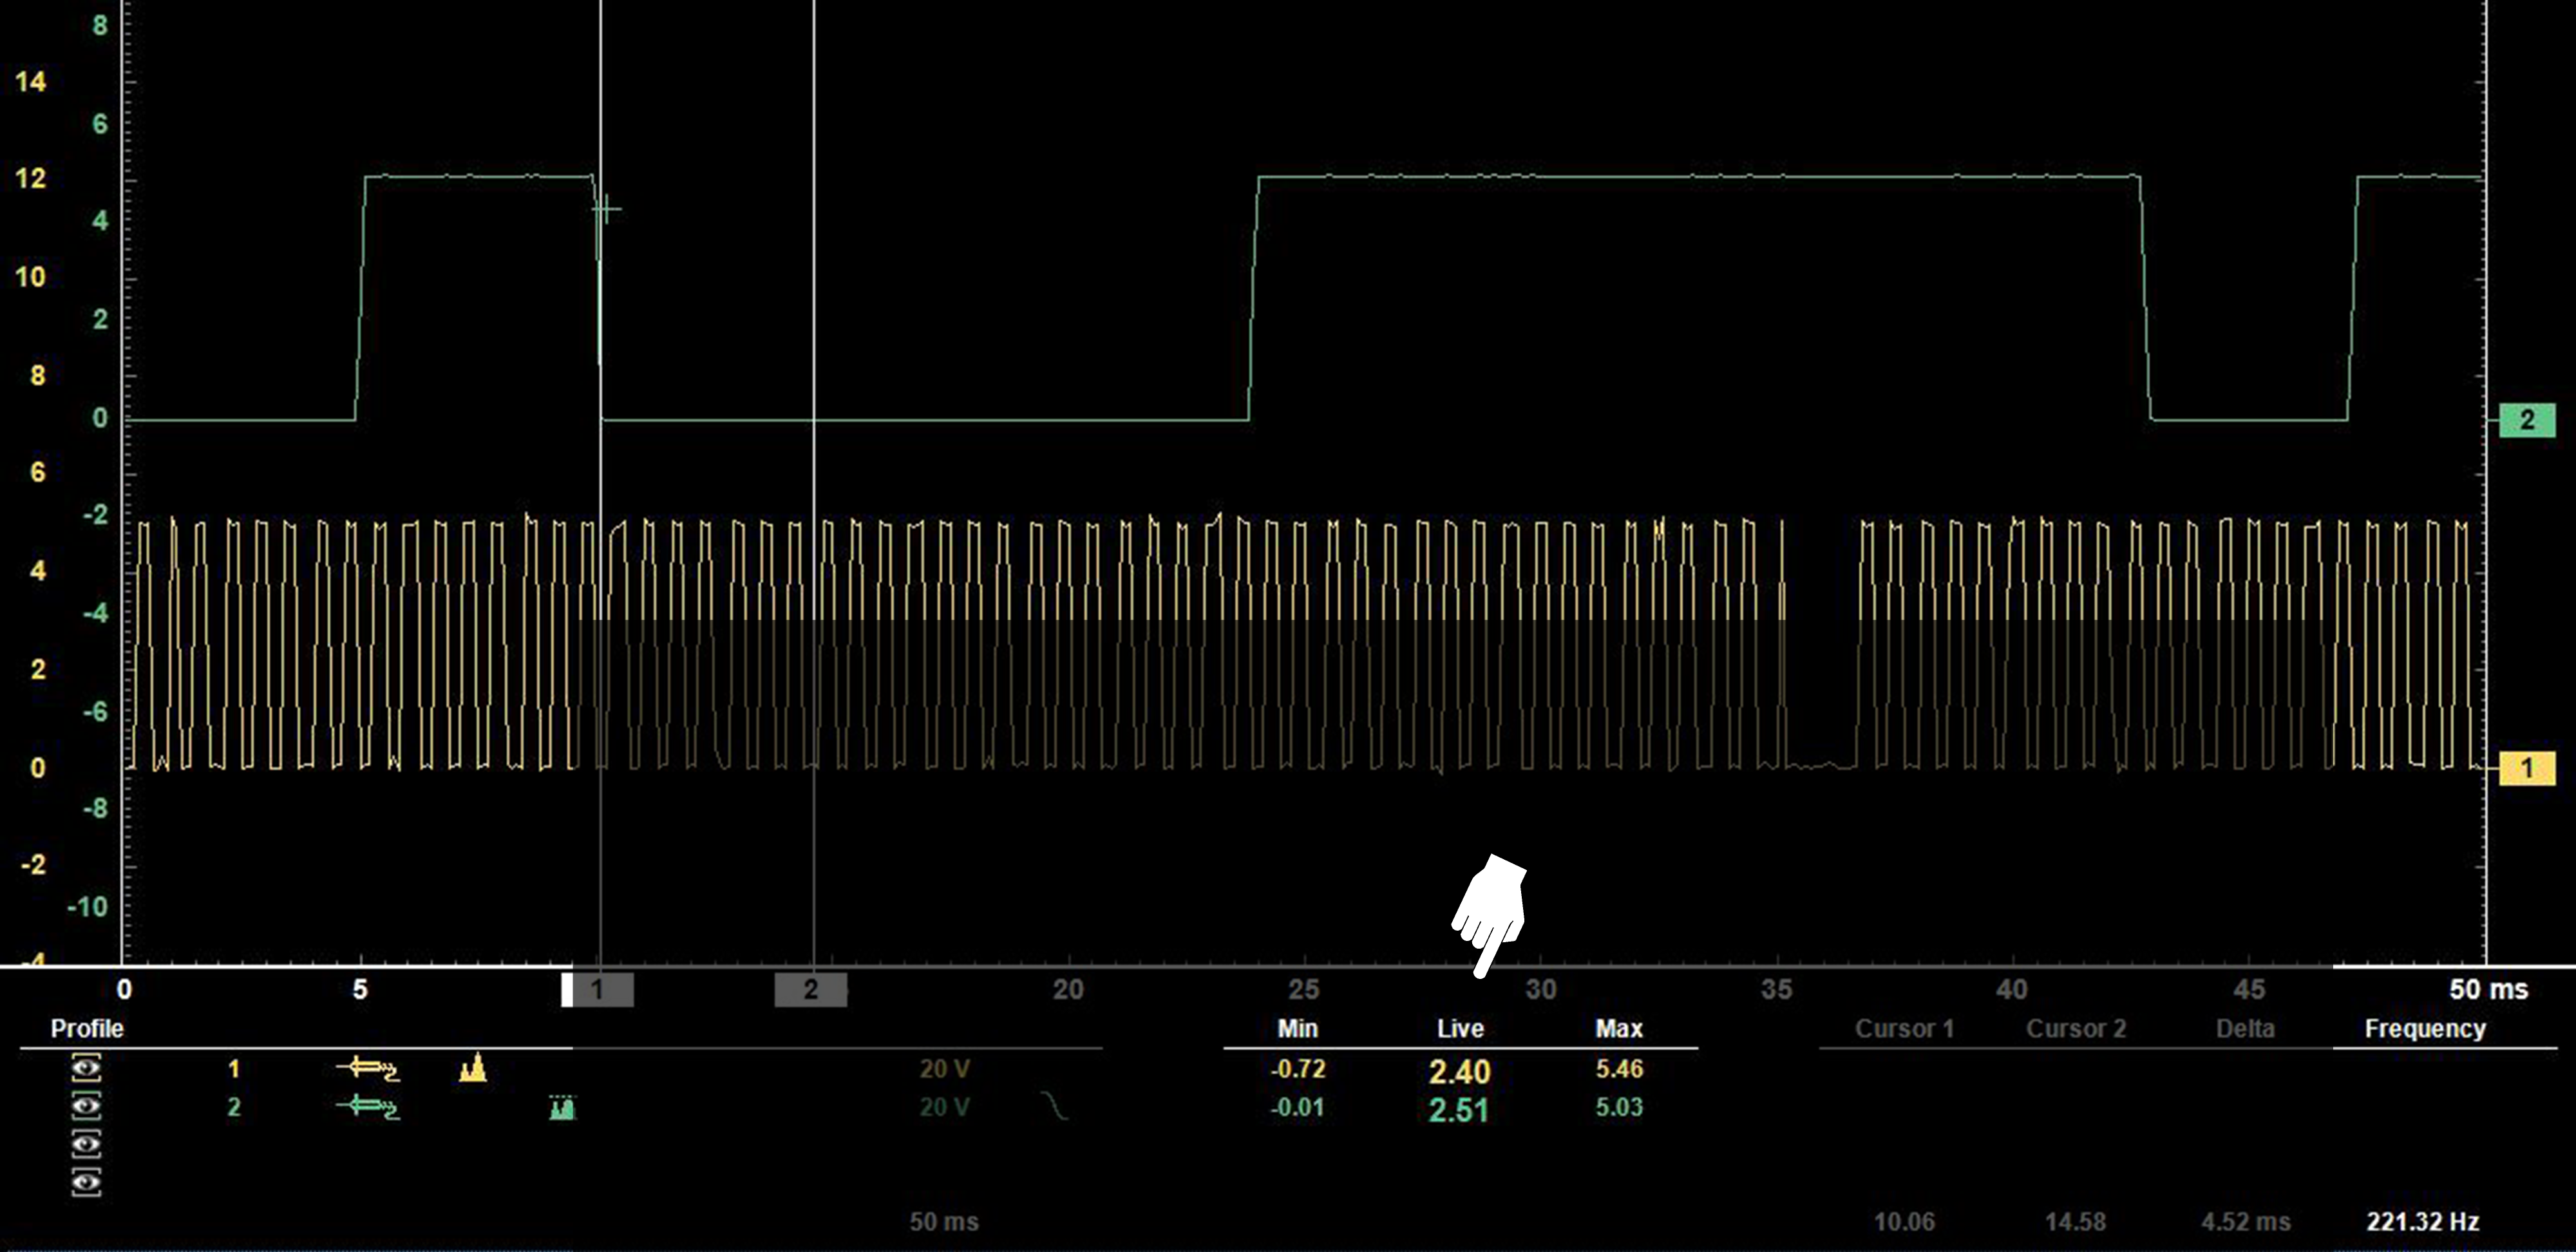
When using Expanded mode the Min, Live and Max display panel shows each channel’s active signal minimum and maximum recorded measurements and live measurement.
| ● | Min - lowest measurement recorded for the signal since the test was activated, or from the last time Refresh was selected |
| ● | Max - highest measurement recorded for the signal since the test was activated, or from the last time Refresh was selected |
| ● | Live - represents the “live” running average measurement of the signal being measured |
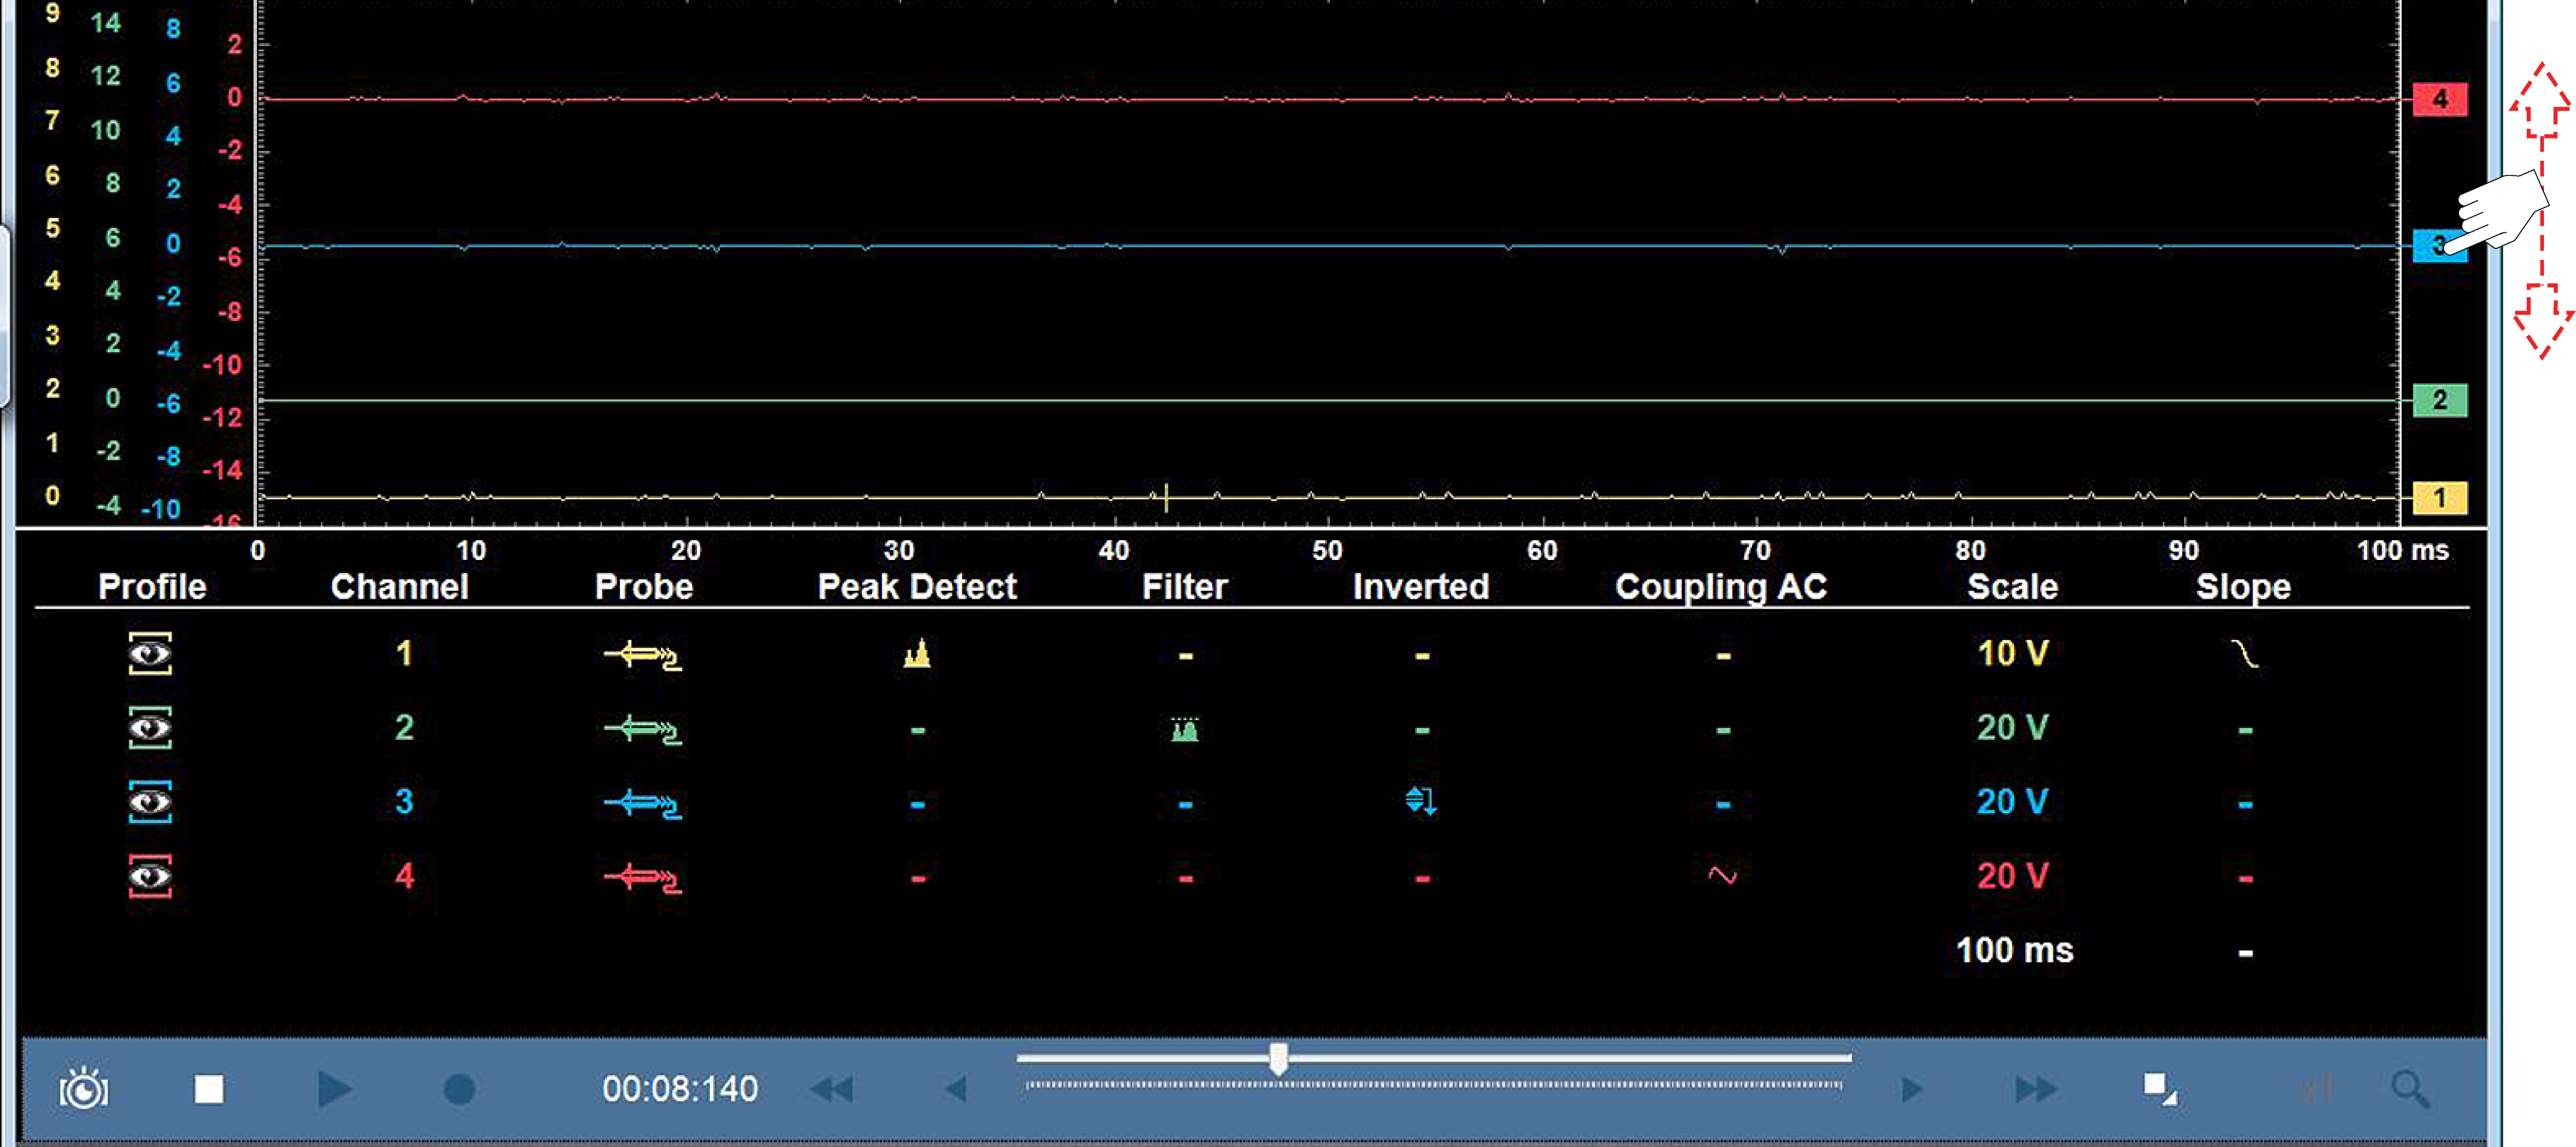
To adjust the vertical position of the zero baseline (0 value) of a trace, either touch and drag the baseline marker up/down on the screen, or open the trace setup menu to make precise adjustments, see Trace Controls Menu.
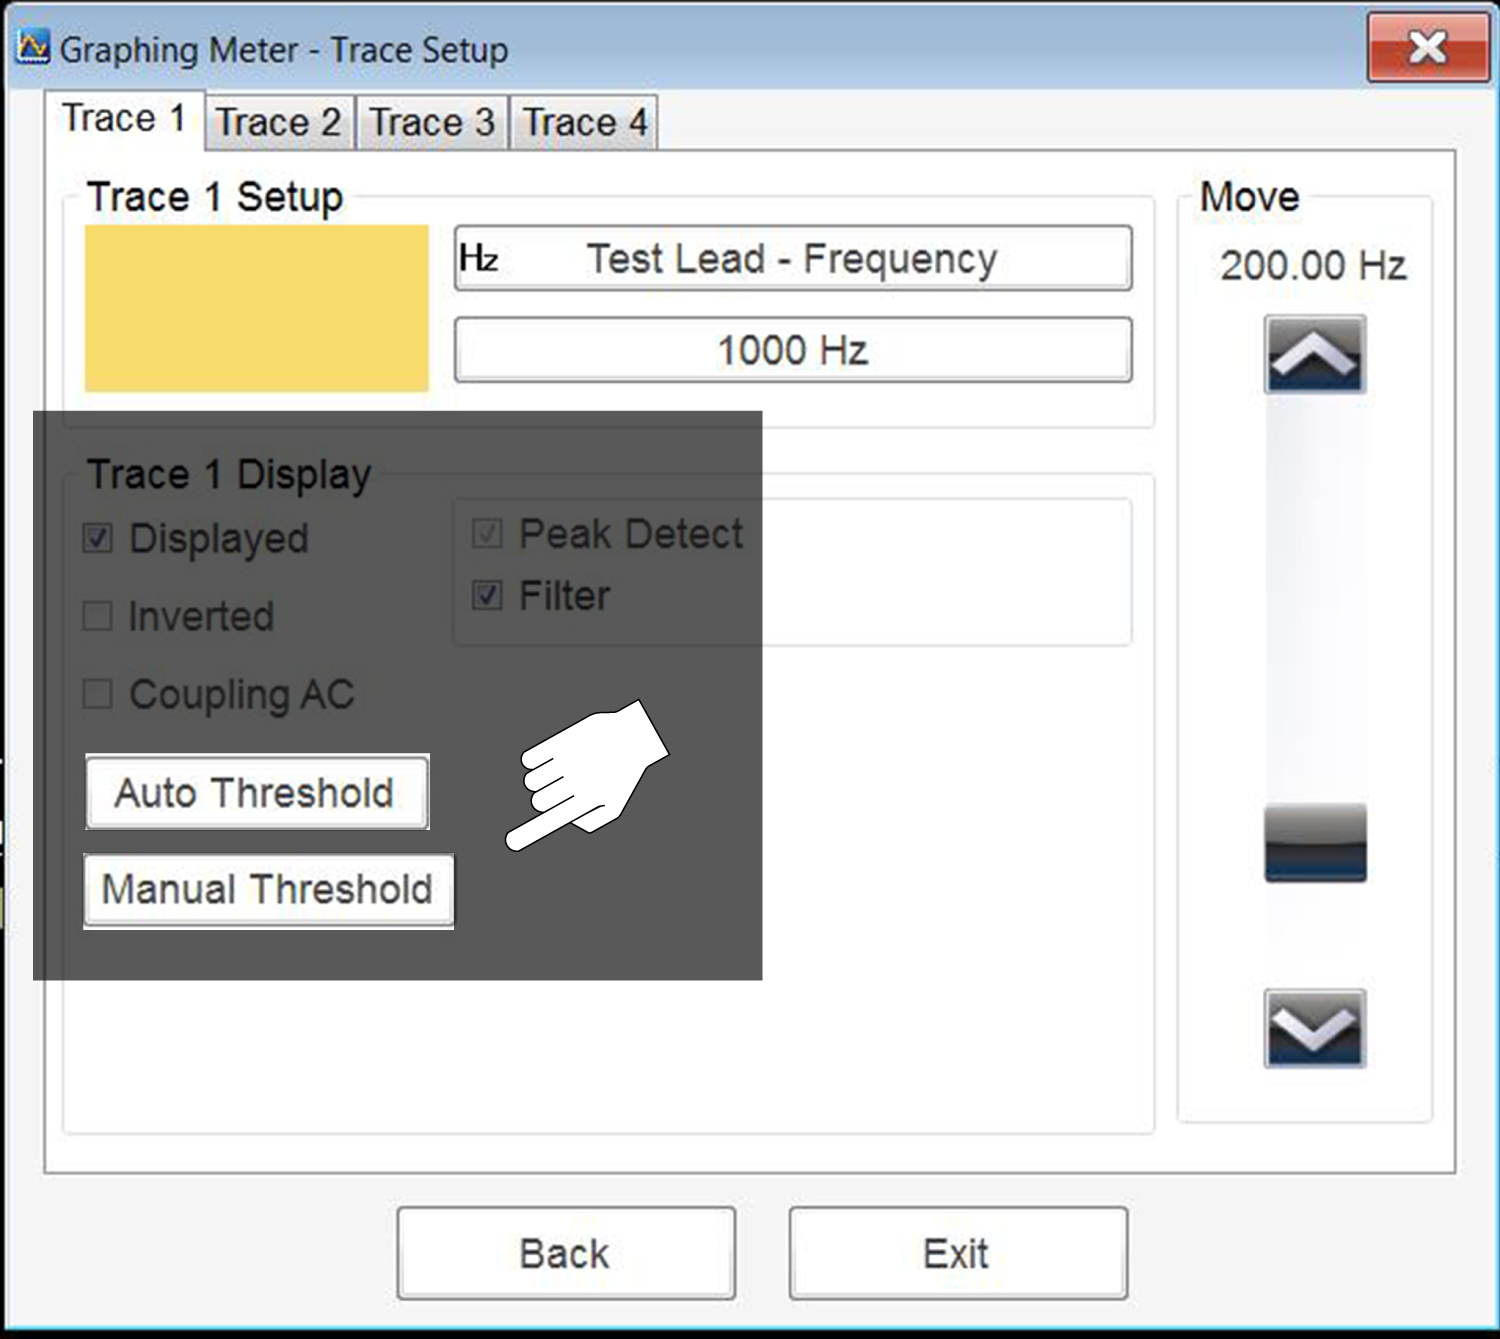
The Threshold function is only available in the Graphing Meter function for specific tests. These functions may also be referred to as Auto Threshold Select (ATS) or Manual Threshold (MT).
The Threshold function can be used, to display and obtain a more accurate measurement when measuring signals (e.g. Frequency, Duty Cycle, MC Dwell and Pulse Width) that may be difficult to display or have noise or other undesirable variations in the signal.
When Auto Threshold is selected, the Threshold function automatically sets a trigger and determines a threshold level in the middle of the signal range (calculated from the Min and Max measurements) to be used as a reference point to calculate the measurement. The falling edge (slope) of the signal is used in determining the threshold level. Once selected, the Threshold function remains active until the test is exited.
Selecting Manual Threshold, allows you to manually set the value and slope.
The following examples are provided, showing some common setup issues you may experience when using this function
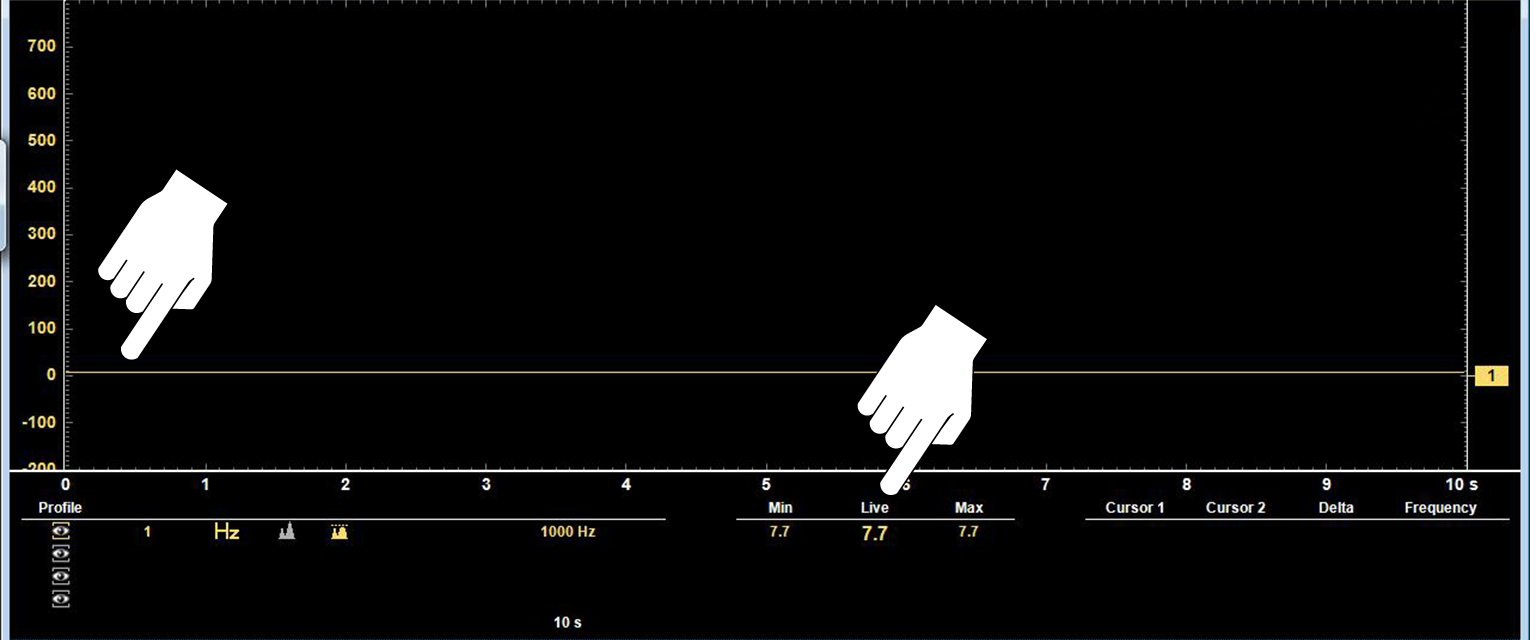
If after enabling the Threshold function the signal is displayed as a flat line at
zero (0) , reduce the vertical scale setting, as it may be set too high.
Scale at 1000Hz, frequency appears to be zero (is actually 7.7Hz)
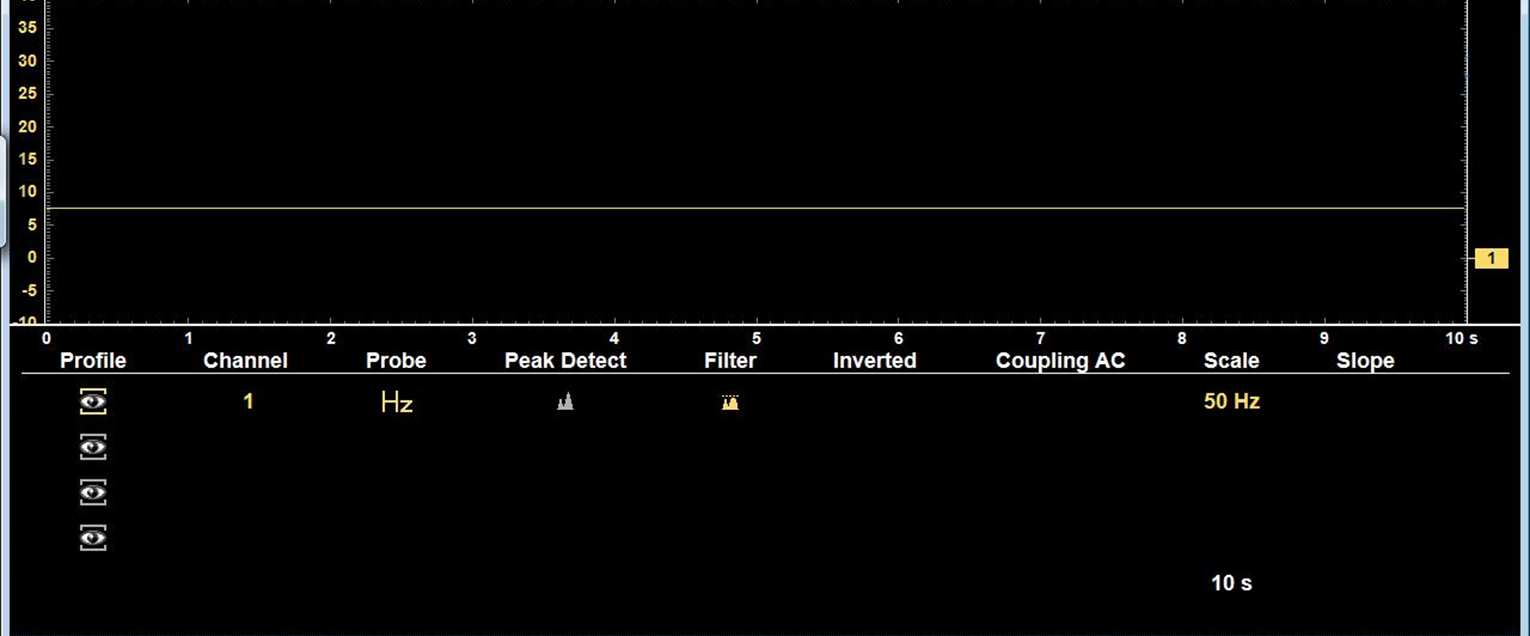
If the scale is changed to 50Hz, it is easier to see the signal at 7Hz ).
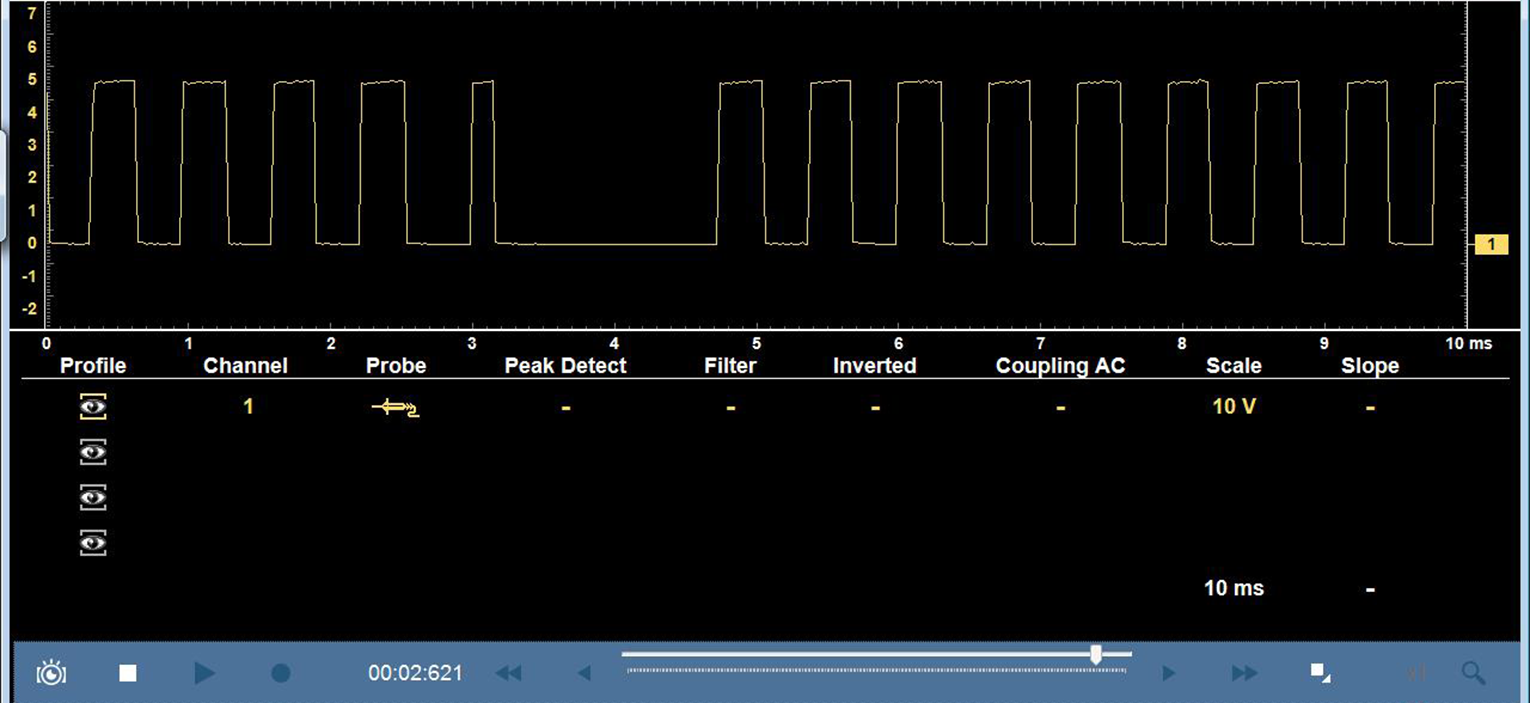
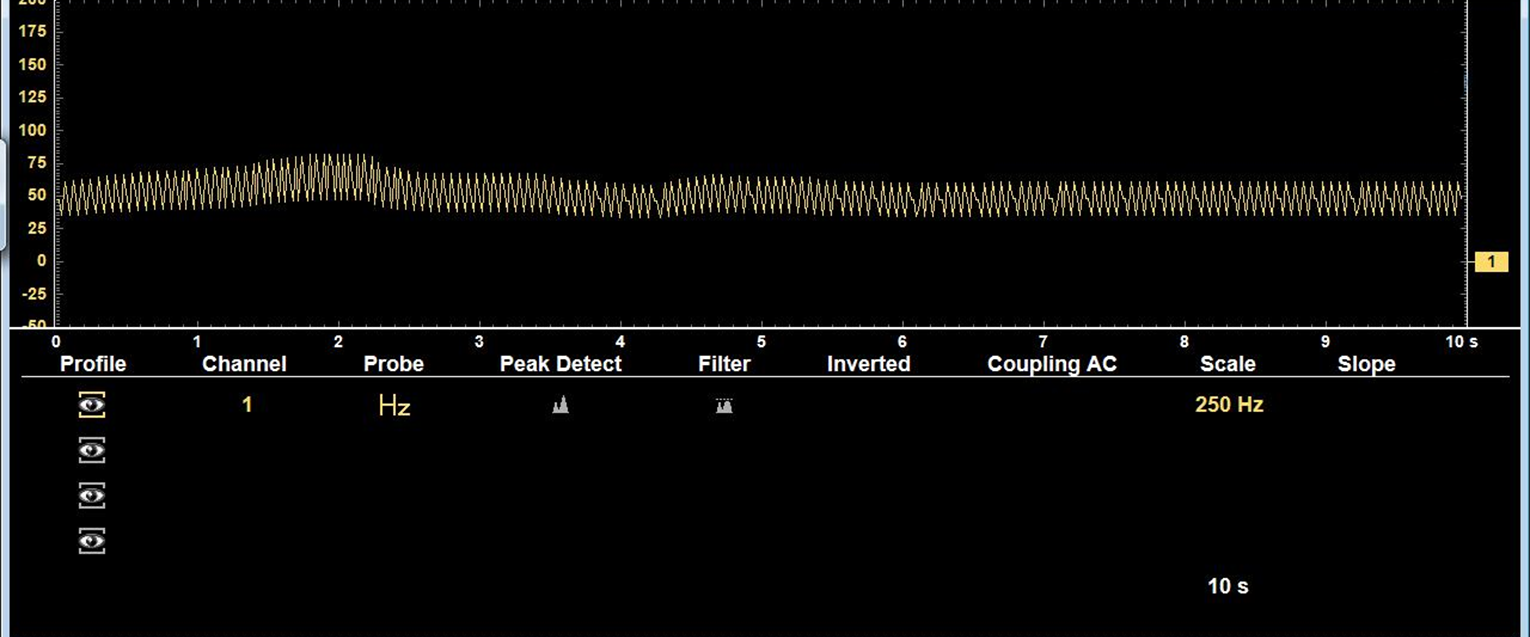
In some instances a signal with unequal spacing may display as a band or ragged signal, depending on the sweep setup or the measurement type being displayed. As example, a Cam sensor signal Hz graph may look like this with a lot of variation.
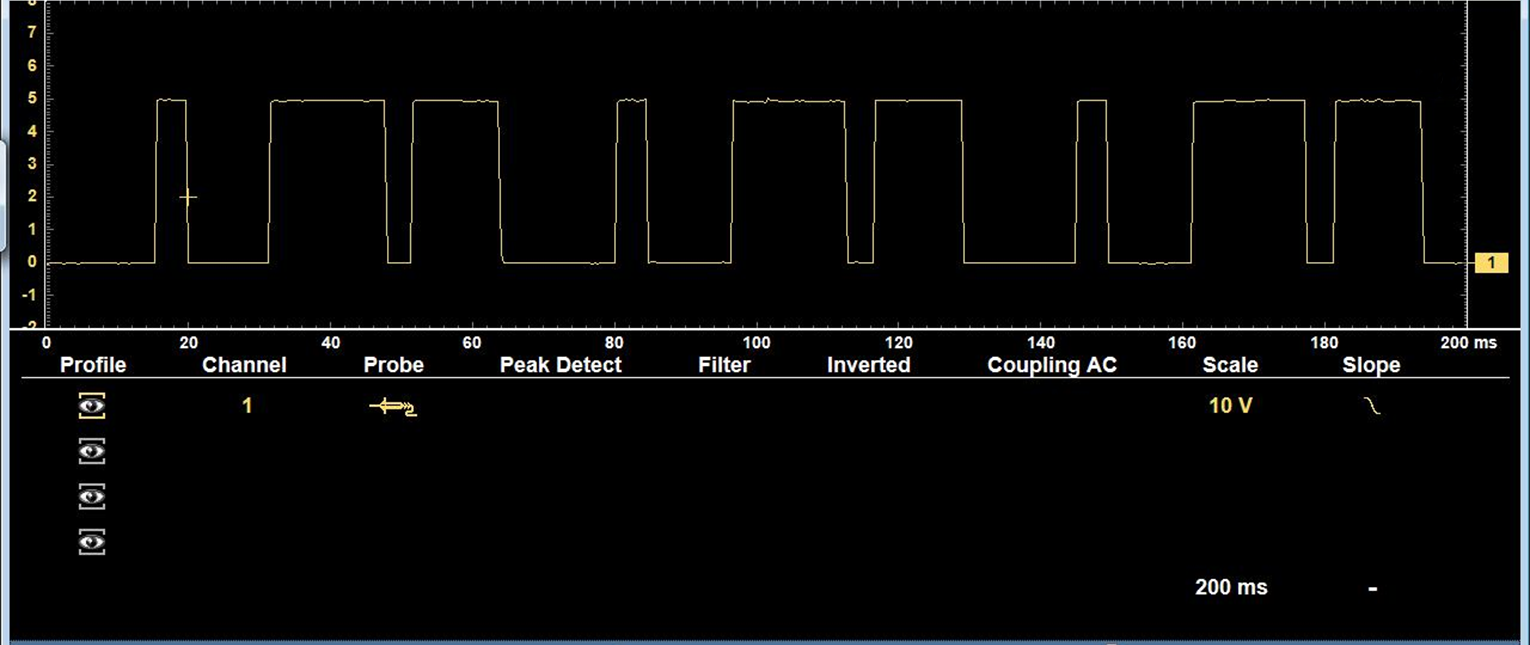
In this situation, you can use the lab scope to verify the signal integrity and spacing.
Displayed in Lab scope , it can be seen there is actually variation which the Hz graph is not displaying.
Cam signal (Lab Scope)
