Selecting Setup ![]() (upper toolbar) opens a menu including the following options:
(upper toolbar) opens a menu including the following options:
Trace controls are used to adjust individual characteristics of how the signal is sampled and displayed for each of the four traces.
| 1. | Select Setup (upper toolbar). |
The Scope Multimeter Preferences dialog box opens.
| 2. | Select Traces. |
| 3. | Select the trace to be configured from the submenu. |
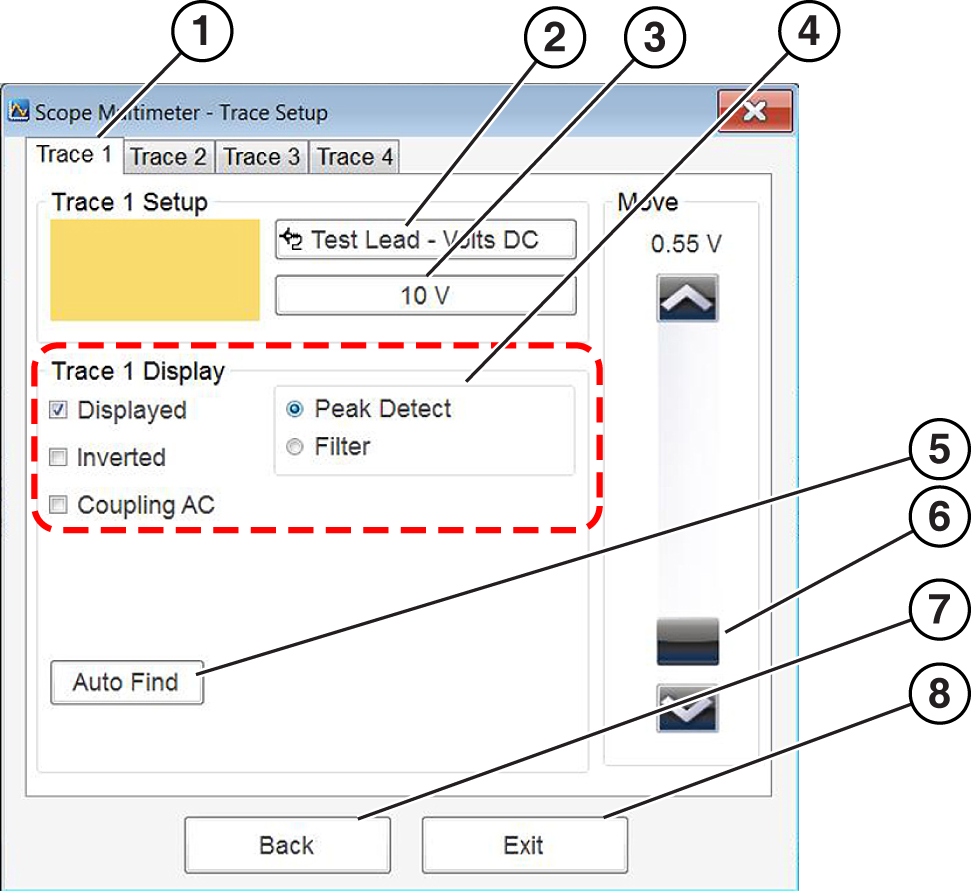
The traces dialog box displays.
| 1. | Trace Setup Tabs - Individual tabs for each trace (channel) |
| 2. | Probe Selection Icon - Opens probe selection menu |
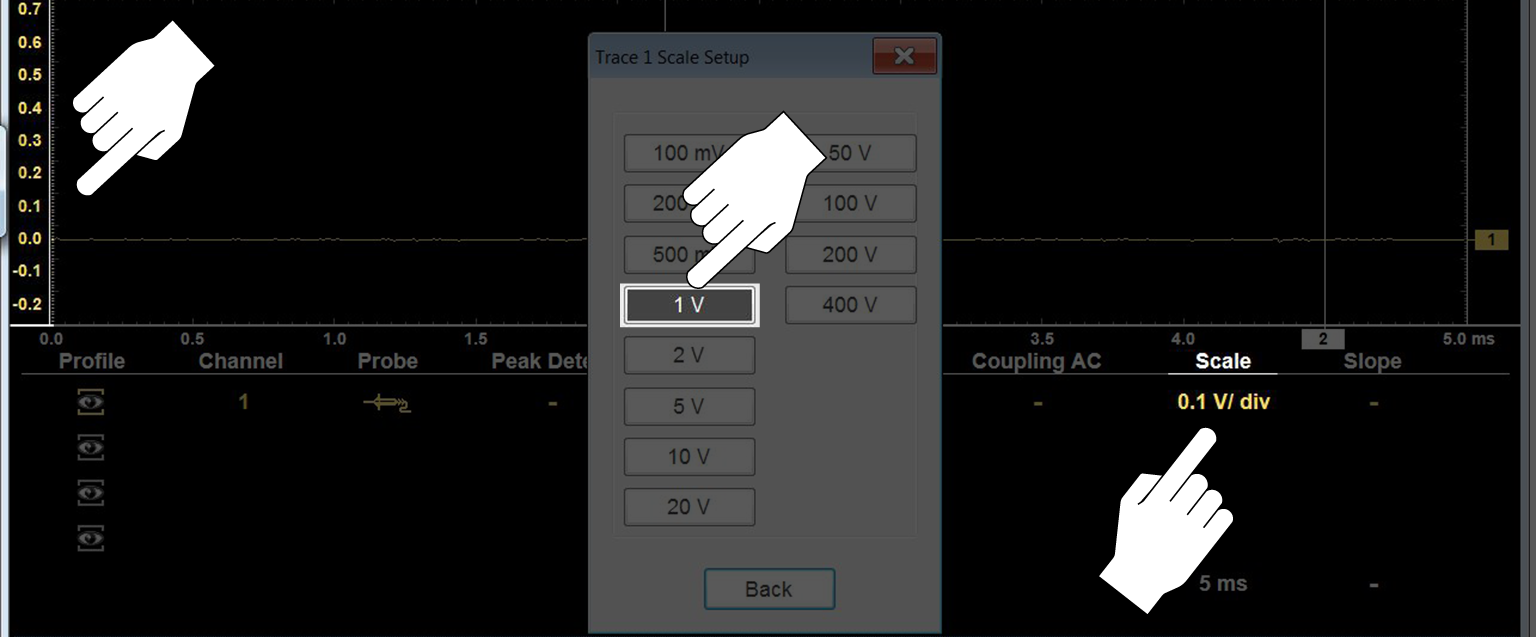
| 3. | Scale (Vertical) Setting Icon - Opens Scale value selection menu |
| 4. | Trace Settings - Select or deselect the trace characteristic items as needed: |
Displayed - display or hide the trace
Inverted - see Invert Icon
Coupling AC- see Coupling AC Icon
Peak Detect- see Peak Detect Icon
Filter- see Filter Icon
| 5. | Auto Find - Sets the scope to sample the signal and internally calculate the best way to display it. |
A scale and the vertical position for the zero line of the trace that allows the whole waveform to fit on the screen is established when Auto Find is selected.
If Auto Find is selected on an armed trigger, it also sets the trigger level halfway between the minimum and maximum value of the signal to provide a stable waveform.
| 6. | Zero Baseline Adjustment - use the slider and arrows to precisely adjust the zero baseline |
| 7. | Back - closes the dialog box to return to the Preferences dialog box |
| 8. | Exit - closes the dialog box and returns to the scope |
Use the view controls to set display attributes.
| 1. | Select Setup from the Scope Multimeter toolbar. |
The Scope Multimeter Preferences dialog box opens.
| 2. | Select View to open a submenu. |
| 3. | Select an option from the submenu dialog box. Option details are explained below. |
Four options are available on the submenu:
| – | Back—use to return to the Preferences dialog box, or select Exit to close the dialog box and return to the scope. |
| – | Display—use to adjust what information displays and how it appears |
| – | Layout—use to set how many traces display and how they display on the screen |
| – | Units—use to adjust time and voltage interval settings |
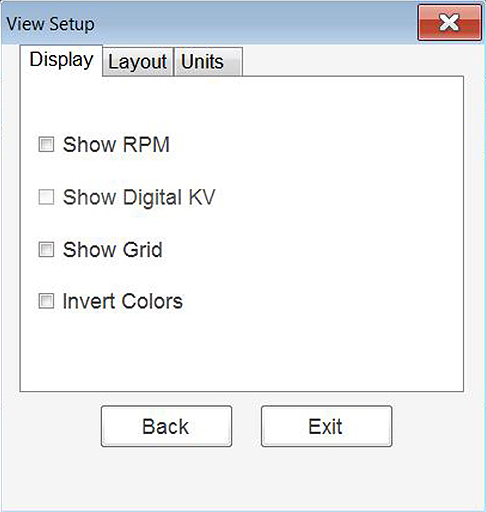
Selecting Display from the View submenu opens the Display dialog box .
Sample Display dialog box
The following options are available from the Display dialog box:
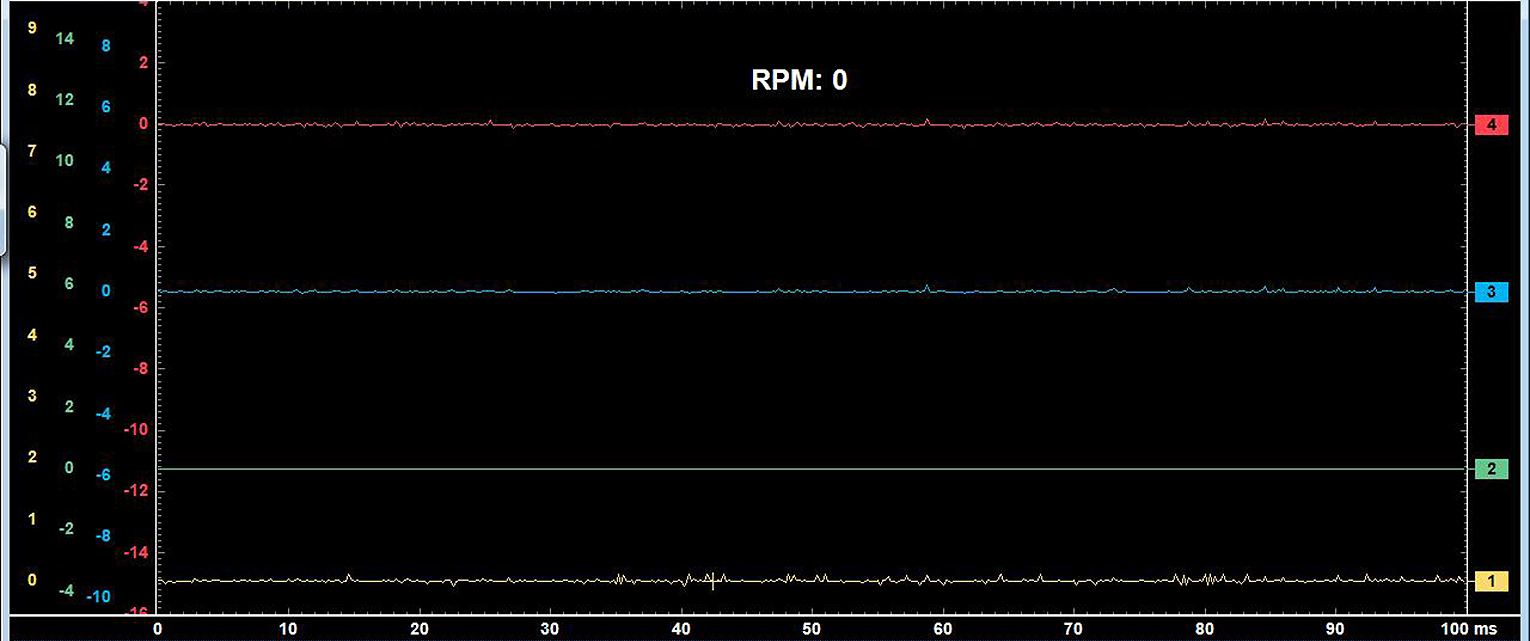
| ● | Show RPM—adds an engine speed field at the top of the screen . |
Sample Show RPM selected
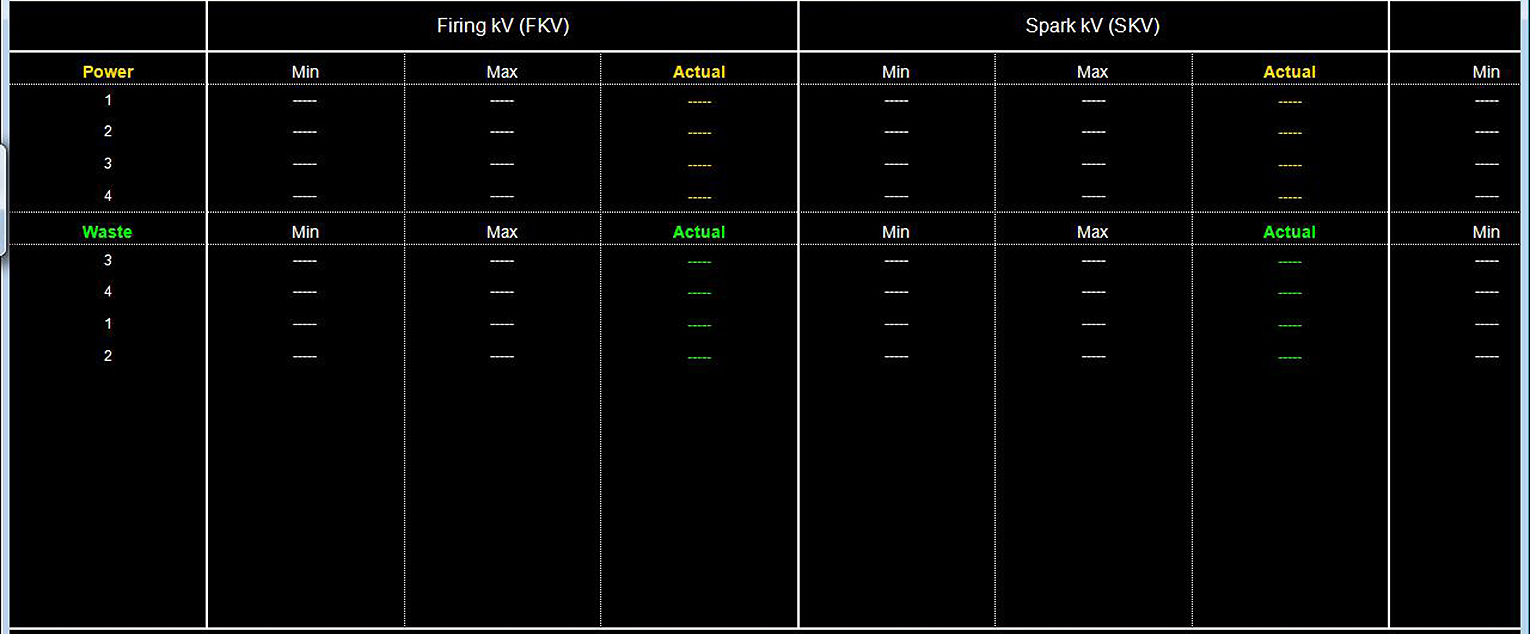
| ● | Show Digital KV—available only in ignition scope, displays digital kilovolt readings, rather than waveforms, on the screen. |
Sample Show Digital KV selected
| ● | Show Grid—switches grid lines on the screen off and on . |
Sample grid selected
| ● | Invert Colors—switches the screen background to white. |
The selected radio knob on the Layout dialog box shows which setting is active. Use your finger or the stylus to switch between settings:
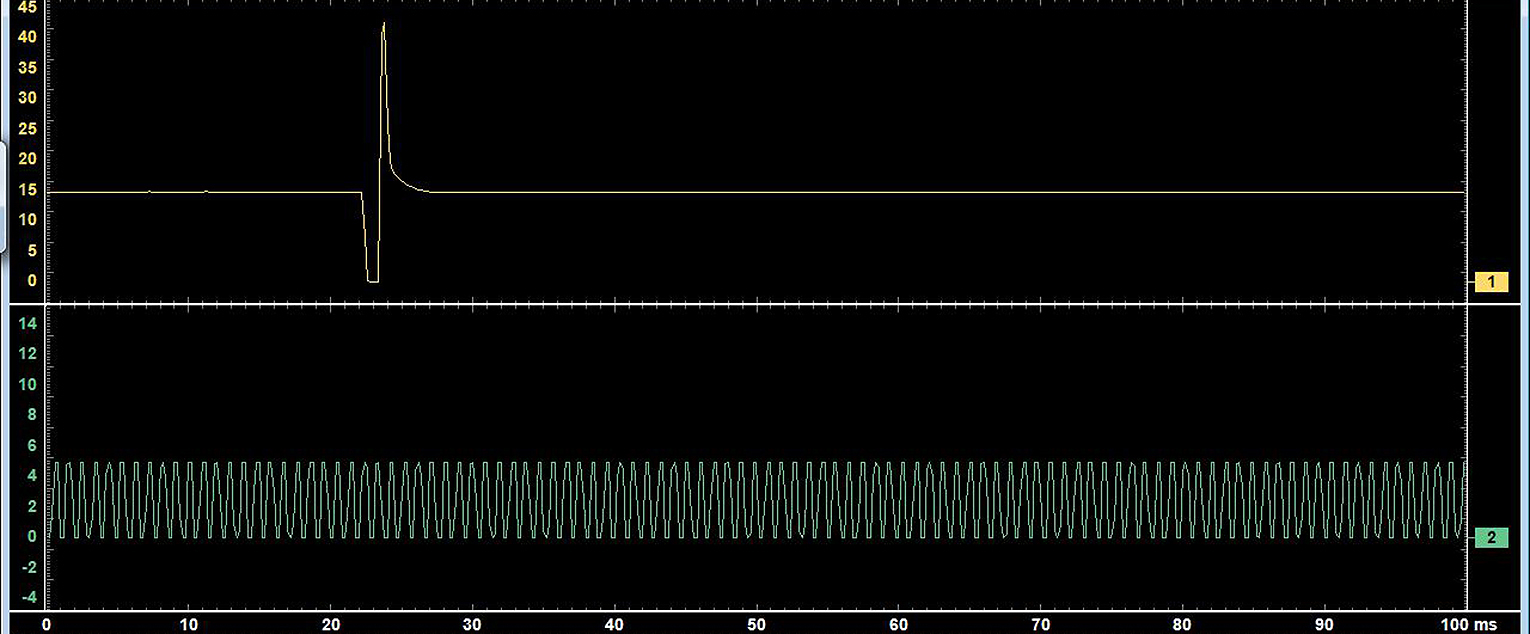
| ● | 1 window—shows all traces on the same screen. |
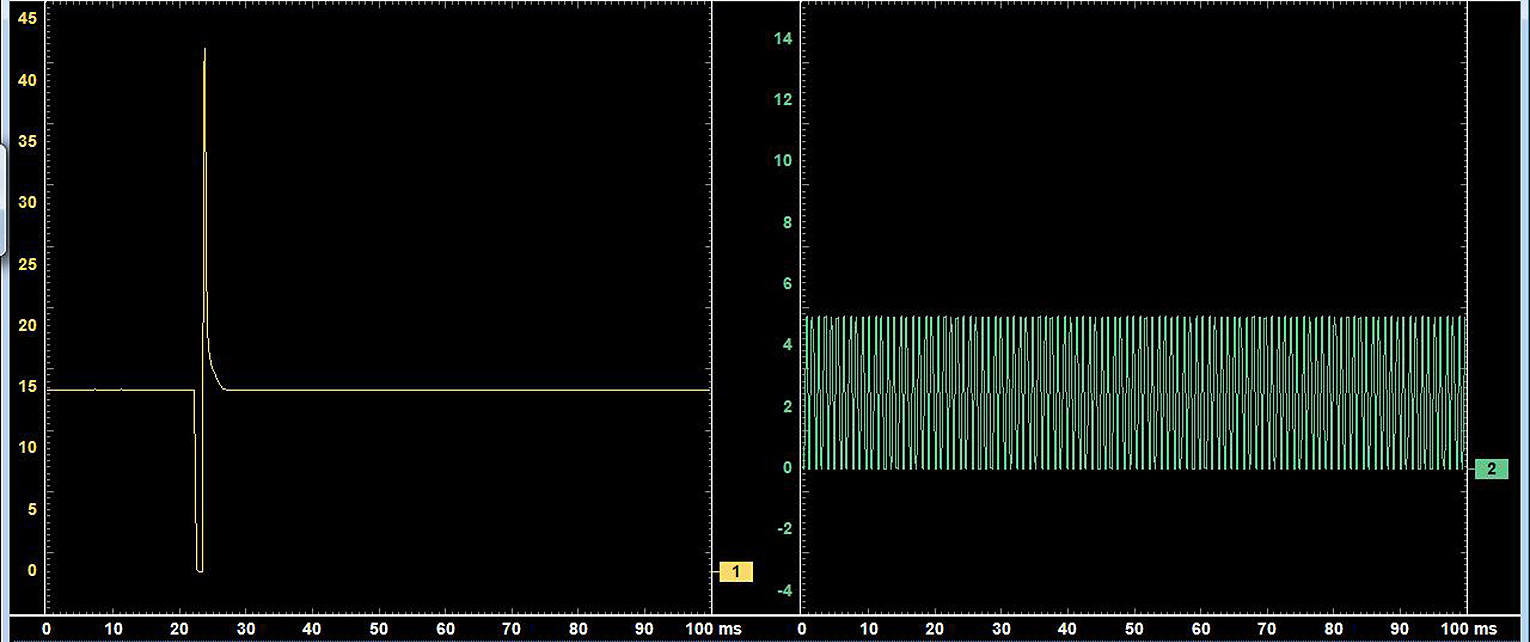
| ● | 2 windows—can show two separate traces in two ways: horizontal, one below another. |
| ● | 2 windows, can also shown vertical, side-by-side. |
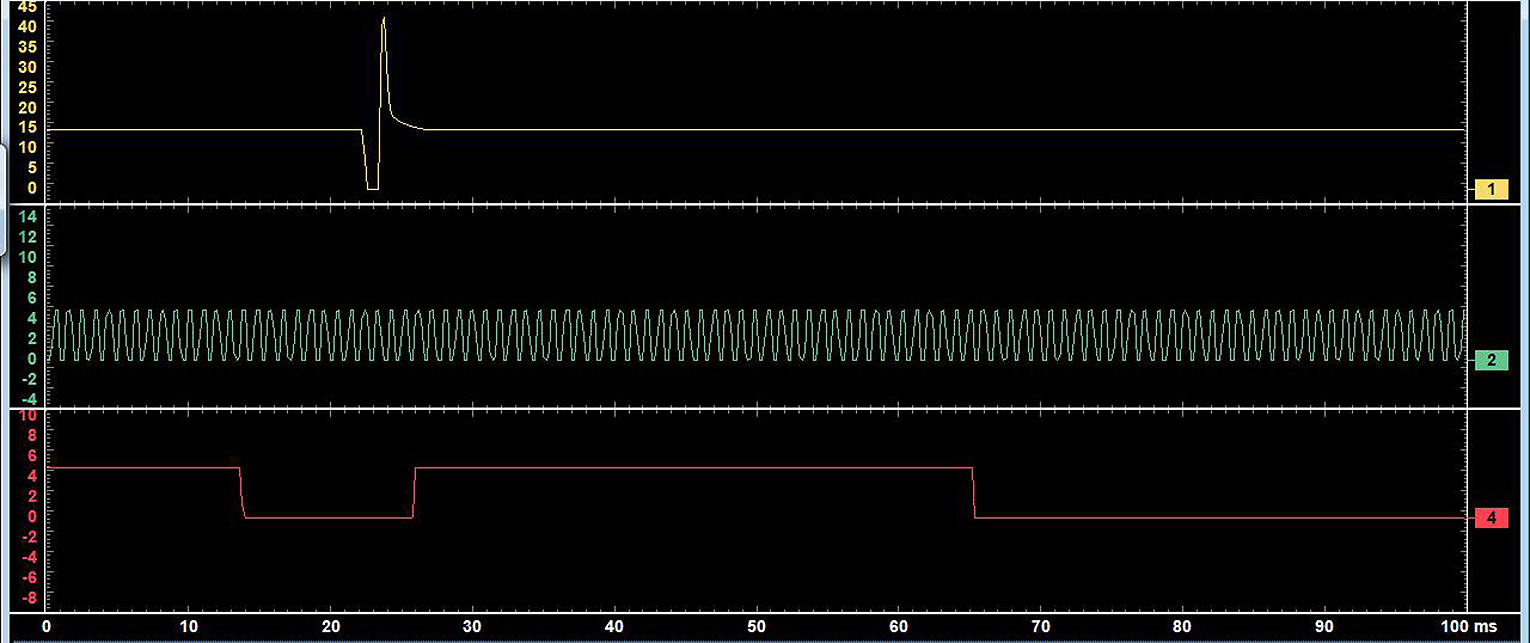
| ● | 3 windows—shows three traces, one below another, on the same screen . |
| ● | 4 windows—shows four traces, one below another, on the same screen. |
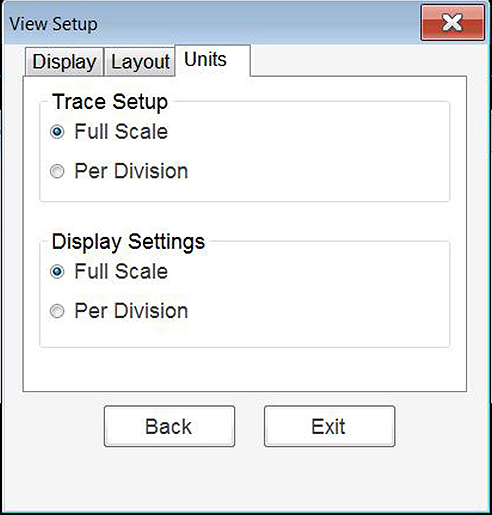
The Unit Setup dialog box allows you to switch between Full Scale or Per Division settings for the trace setup and the display settings. Selecting Full Scale configures the units to the full viewing area of the screen, while Per Division adjusts the units to a single division (one tenth) of the screen.
The selected radio knob on the Units dialog box shows which setting is active. Use your finger or the stylus to switch between settings.
Sample View Units dialog box
The Trace Setup option allows you to change how the vertical scale menu selections are represented.
This setting ONLY changes the vertical scale, the sweep (horizontal) scale is NOT changed.
When adjusting the vertical scale setting, it is important to remember that the vertical scale is divided into 10 major divisions, and all scale adjustments reflect this factor of 10. The division set of 10 cannot be changed, divisions cannot be added or removed.
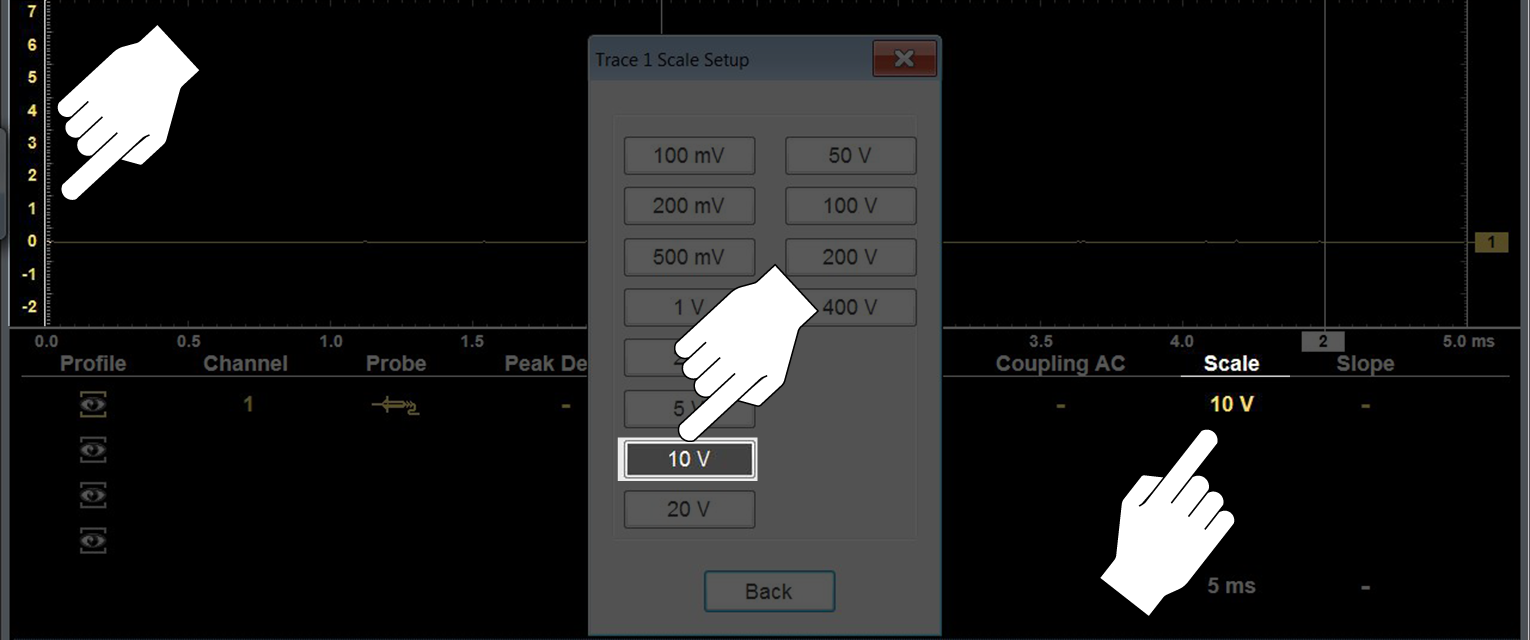
Trace Full Scale - changes the dropdown vertical scale menu selections to full scale mode, which represents the selected unit of measurement over the entire (full) scale.
Example :Selecting 10V, changes the vertical scale to a 10V volt scale. The vertical scale is “always” divided by 10, therefore each division is incremented by 1V.
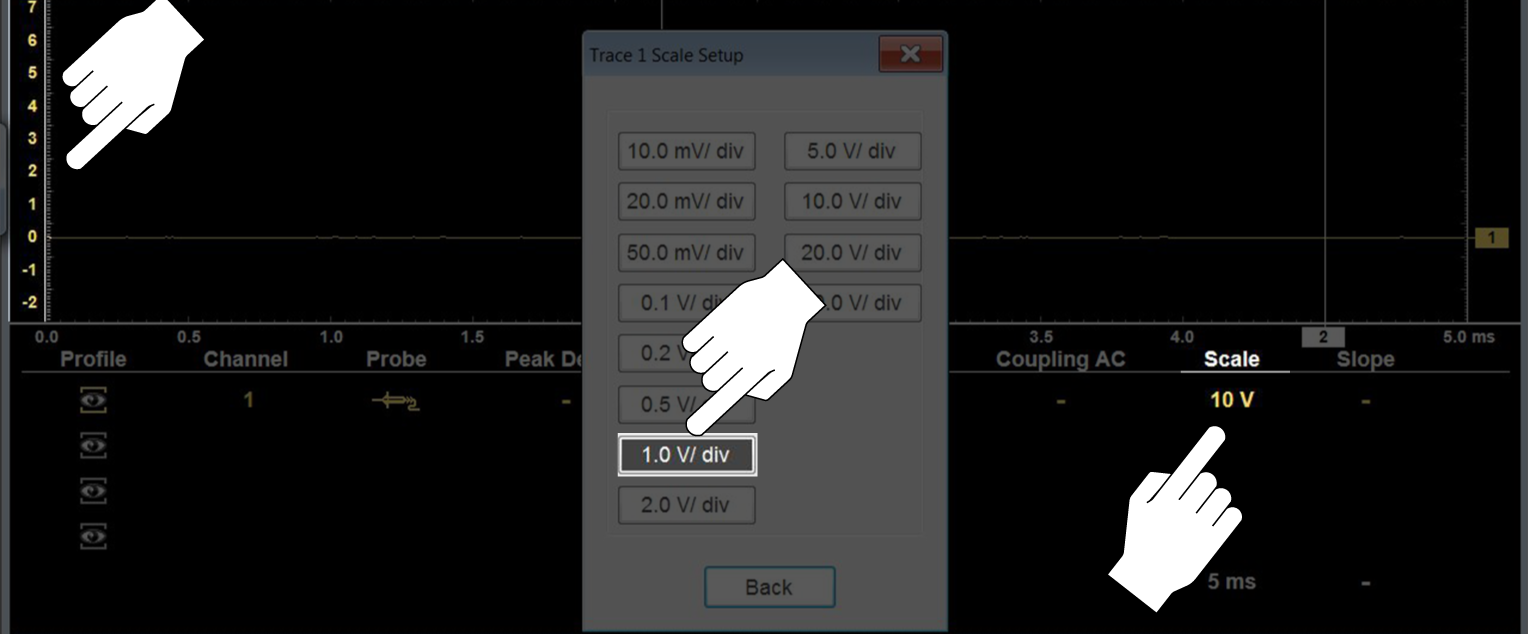
Trace Per Division - changes the dropdown vertical scale menu selections to ##/div mode, which in turn changes the vertical scale to represent ## by division.
## - represents (variable) what is being measured (voltage, amperage, pressure etc.)
Example :Selecting 1.0V/div, displays a vertical scale divided by 10. The vertical scale is “always” divided by 10, therefore each division is incremented by 1.0V, thus a 10V scale.
The Display setting allows you to change the displayed value in the Vertical Scale icon to your preference.
This setting ONLY changes the value displayed in the Vertical Scale icon.
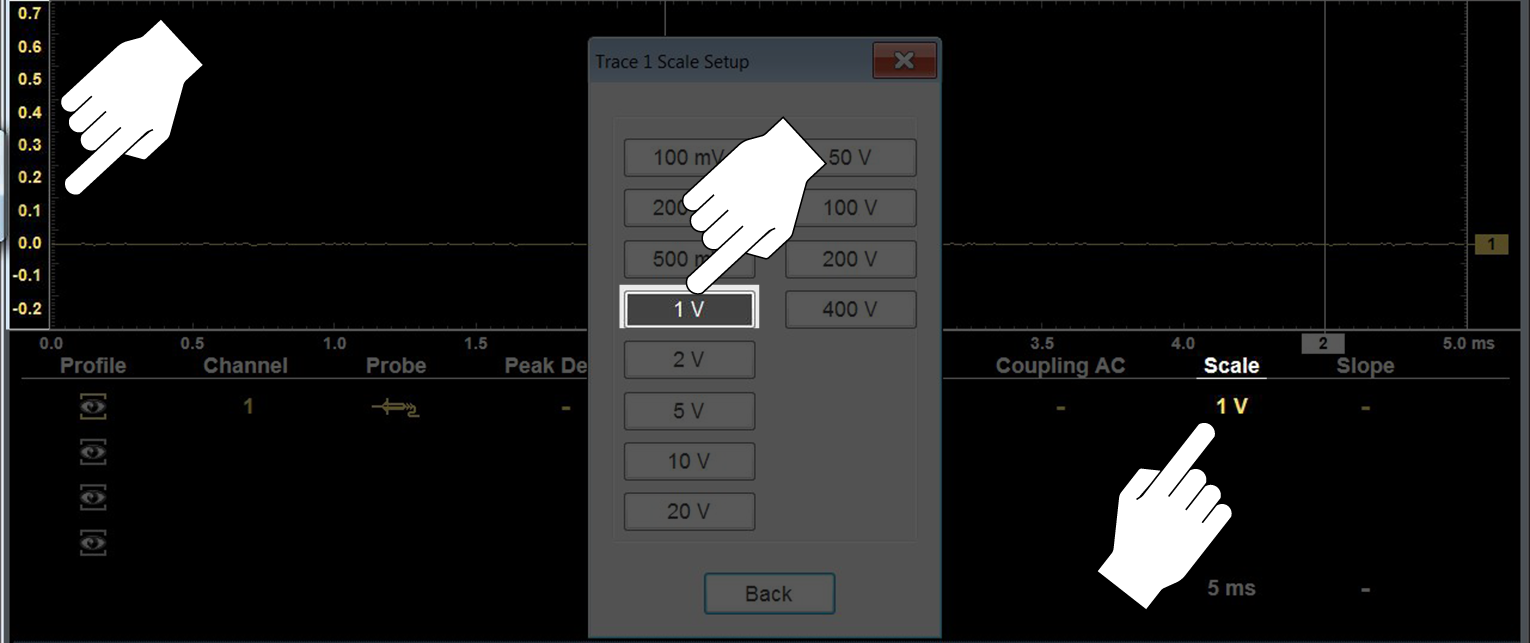
Display Full Scale - displays the value of the entire (full) scale
Example:If the vertical scale is set to 1V, the value displayed is 1V.
Display Per Division - displays the graduation value of the major scale divisions
Example:If the vertical scale is set to 1V, the value displayed is 0.1V.
Basic tool settings are adjusted here.
| 1. | Select Setup from the Scope Multimeter toolbar. |
The Scope Multimeter Preferences dialog box opens
| 2. | Select Setup from the dialog box. |
A submenu of options displays:
| – | Back—use to return to the Preferences dialog box. |
| – | Units—set how measurement values display, US standard or metric. |
| – | Snapshot—adjust the percentage of data captured after a snapshot is initiated. |
| – | Ignition—configure the ignition scope for the test vehicle. |
Selecting from the submenu opens a dialog box for that item. Dialog box options for each item are discussed in the following sections.
| 3. | Make dialog box selections as needed. |
| 4. | Select Exit to close the dialog box and return to the scope. |
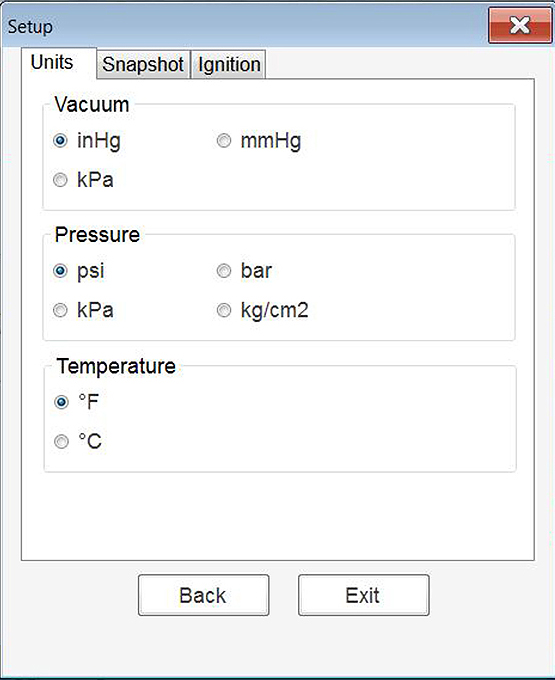
Selecting Units opens the Setup dialog box. The units of measurement can be changed between US customary or metric. The selected radio knobs on the Setup dialog box show which settings are active .
Sample Setup Units dialog box
|
Abbreviation |
Description |
|
bar |
bar |
|
inHg |
inches of mercury |
|
kg/cm2 |
kilograms per centimeter squared |
|
kPa |
kilopascal |
|
mmHg |
millimeters of mercury |
|
psi |
pounds per square inch |
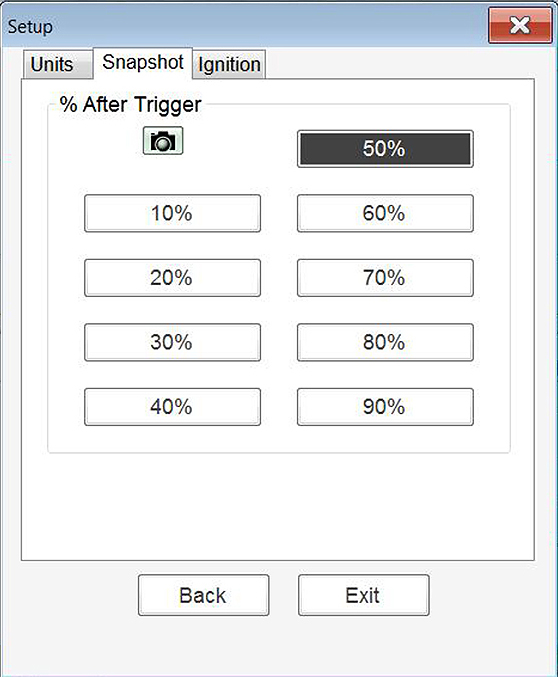
The Snapshot tab opens a menu that allows you to select how much data is captured after a snapshot is initiated. Make a (%) selection, then select Back or Exit to close the dialog box.
See Taking a Data Snapshot for information on using the snapshot feature.
See Ignition Scope.
