![]()
This section describes the basic operation, and navigation of the Data Manager functions.
Data Manager is used to store, sort, and view saved files.
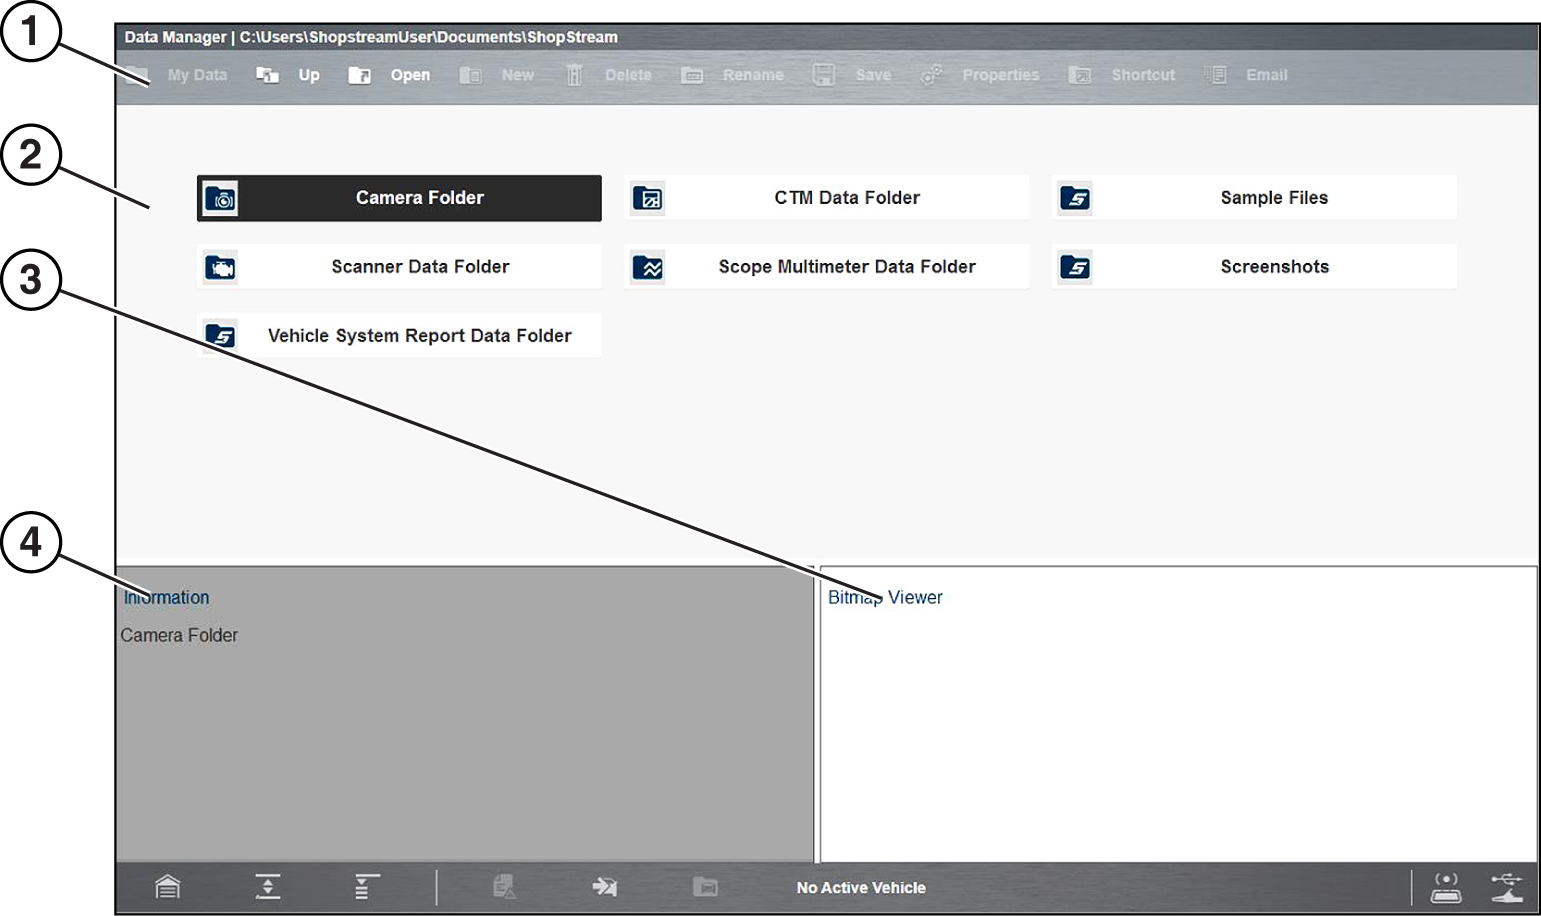
Selecting Data Manager opens the Data Manager screen displaying available file folders and a file viewer.
= Home Screen > Data Manager
This screen displays the contents of the Windows My Documents > ShopStream folder.
Typical - Data Manager main screen
| 1. | Data Manager Toolbar |
| 2. | Folders Panel |
| 3. | Preview Panel - displays image files |
| 4. | Information Panel - displays a description of the selected file. Text changes are allowed for PID and Scope files, not image files. Use the Save icon to save changes. |
The folders panel may includes these folders:
| ● | Camera Folder—contains photos taken with the built-in camera. |
| ● | CTM Data Folder—contains saved Guided Component Test data files. |
| ● | Sample Files—contains an assortment of example data files. |
| ● | Scanner Data Folder—contains saved Scanner data files. |
| ● | Scope Multimeter Data Folder—contains saved Scope Multimeter files. |
| ● | Screenshots—contains saved screen images. |
| ● | Vehicle System Report Data Folder—contains saved vehicle code scan reports. |
| ● | ADAS Report Data Folder—contains saved vehicle ADAS reports. |
General Information
Files saved within the Diagnostic Suite (e.g. Screenshots, Data Files) are saved in the Windows My Documents > ShopStream folder, the Data Manager folder panel contains the same folders.
Printing Files
Select files may have the option to print, see Printing / Printer Setup.
Moving / Copying Files
Using standard Windows operations, you can access, copy or move the saved files in the Windows My Documents > ShopStream folder at anytime.
The files may also be transfered to portable USB drives and then transfered to your PC.
Screenshots/Photos - to view screenshots and photos taken using the built-in camera, see Image Viewer .
Vehicle System Report (Code Scan Report) - to view code scan reports saved while using the Scanner function, see Vehicle System Report Data Folder.
Data Files - data type files (e.g. Scanner, Scope/Multimeter, Guided Component Tests) are saved using proprietary file extensions. To view these types of files, open them through the Data Manager folders panel. Each file type opens within a built-in proprietary viewer.
For Scanner files, see Scanner DataViewer.
For Scope/Multimeter files, see Scope File Viewer.
Data files are not viewable on a PC, however ShopStream Connect can be installed on a PC as an alternative way to view data files. See ShopStream Connect™ (Alternative Viewer) for additional information.
About Saved Folder/File Structure
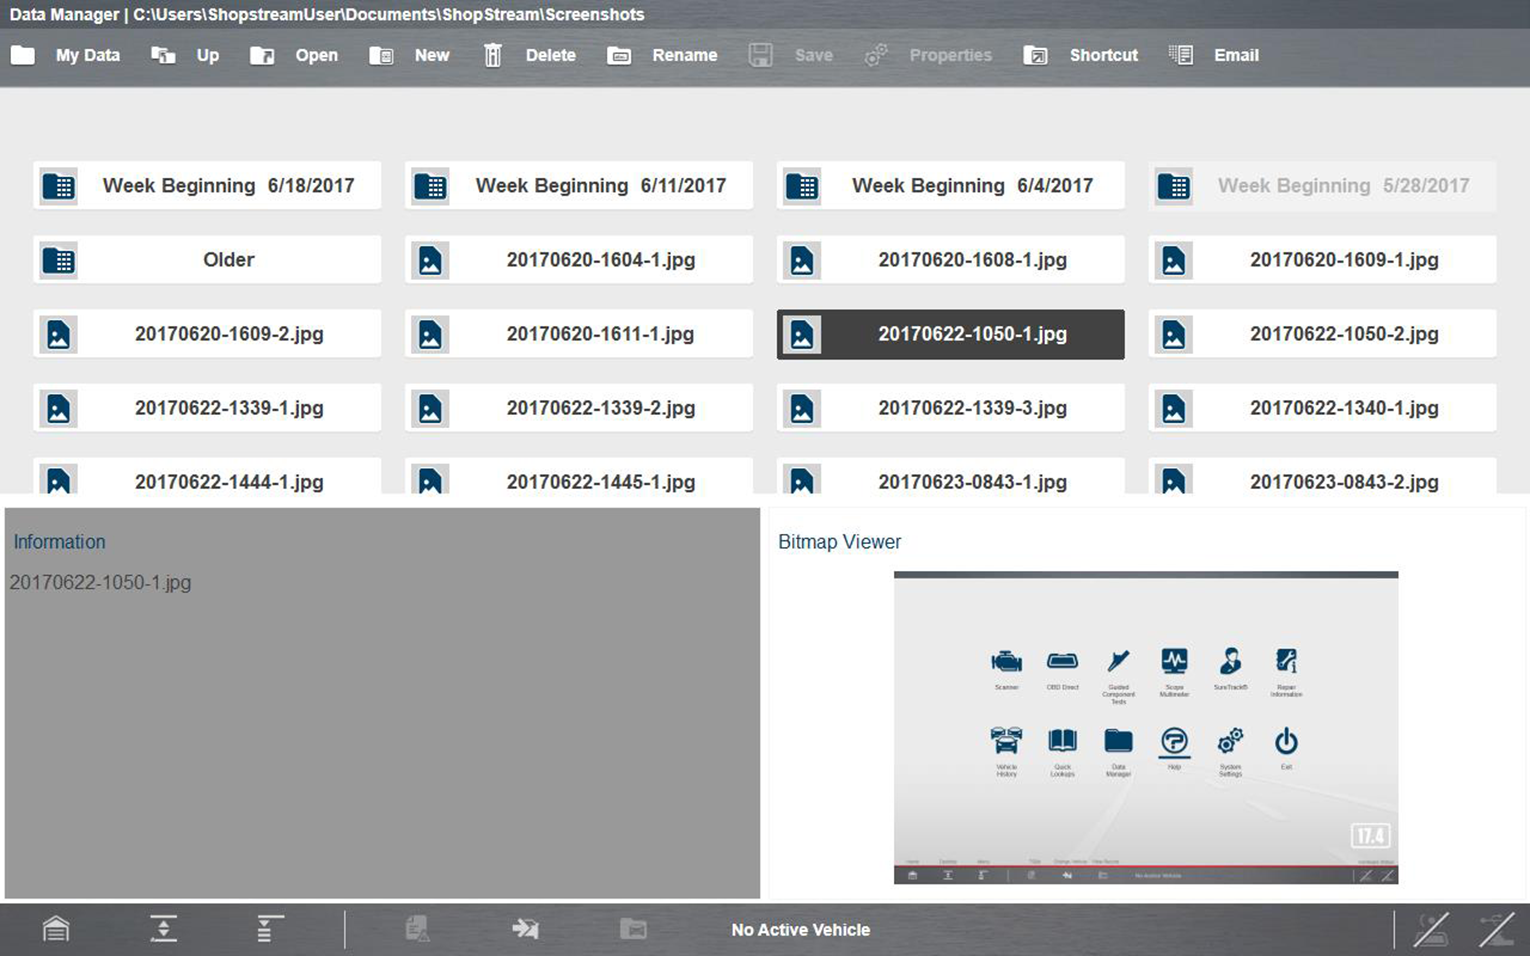
The Diagnostic Suite automatically creates folders to manage saved files. Whenever 60 files are saved into any of the Data Manager folders, a new folder is created. Folders may contain files for a day, week, month, or a year. An older folder, when available, goes to the next higher level in the files structure menu .
Saved file folder structure
Toolbar Icon Functions
|
Icon |
Description |
|
|
My Data - Returns to the Data Manager main screen. |
|
|
Up - Selecting once, moves up one level in the file structure. |
|
|
Open - Opens the highlighted folder or file. |
|
|
New - Creates a new folder. |
|
|
Delete - Moves the highlighted file or folder to the recycling bin. |
|
|
Rename - Allows you to rename a selected file or folder. |
|
|
Save - Saves text changes made in the Information panel. |
|
|
Properties - Allows you to change the file name and assign identifying attributes to Scope / Multimeter data files. |
|
|
Shortcut - Creates a shortcut to the highlighted item on the Data Manager main screen. |
|
|
Email - Send data files as attachments, using Email. See Email for information. |
|
|
More (optional) - Opens hidden menu options |
Selecting the Email icon from the Data Manager toolbar allows you to send a saved data or image file as an attachment using e-mail. To use this feature, you must install an e-mail client, and then either link your existing e-mail address to the client, or create a new address. The following instructions are intended as a guide only.
To attach a file from a Data Manager folder to an e-mail:
The Email feature uses your system default email client. Refer to Windows Help for instructions on setting your default e-mail client. For an example on how to setup an e-mail client, see E-Mail Client Setup.
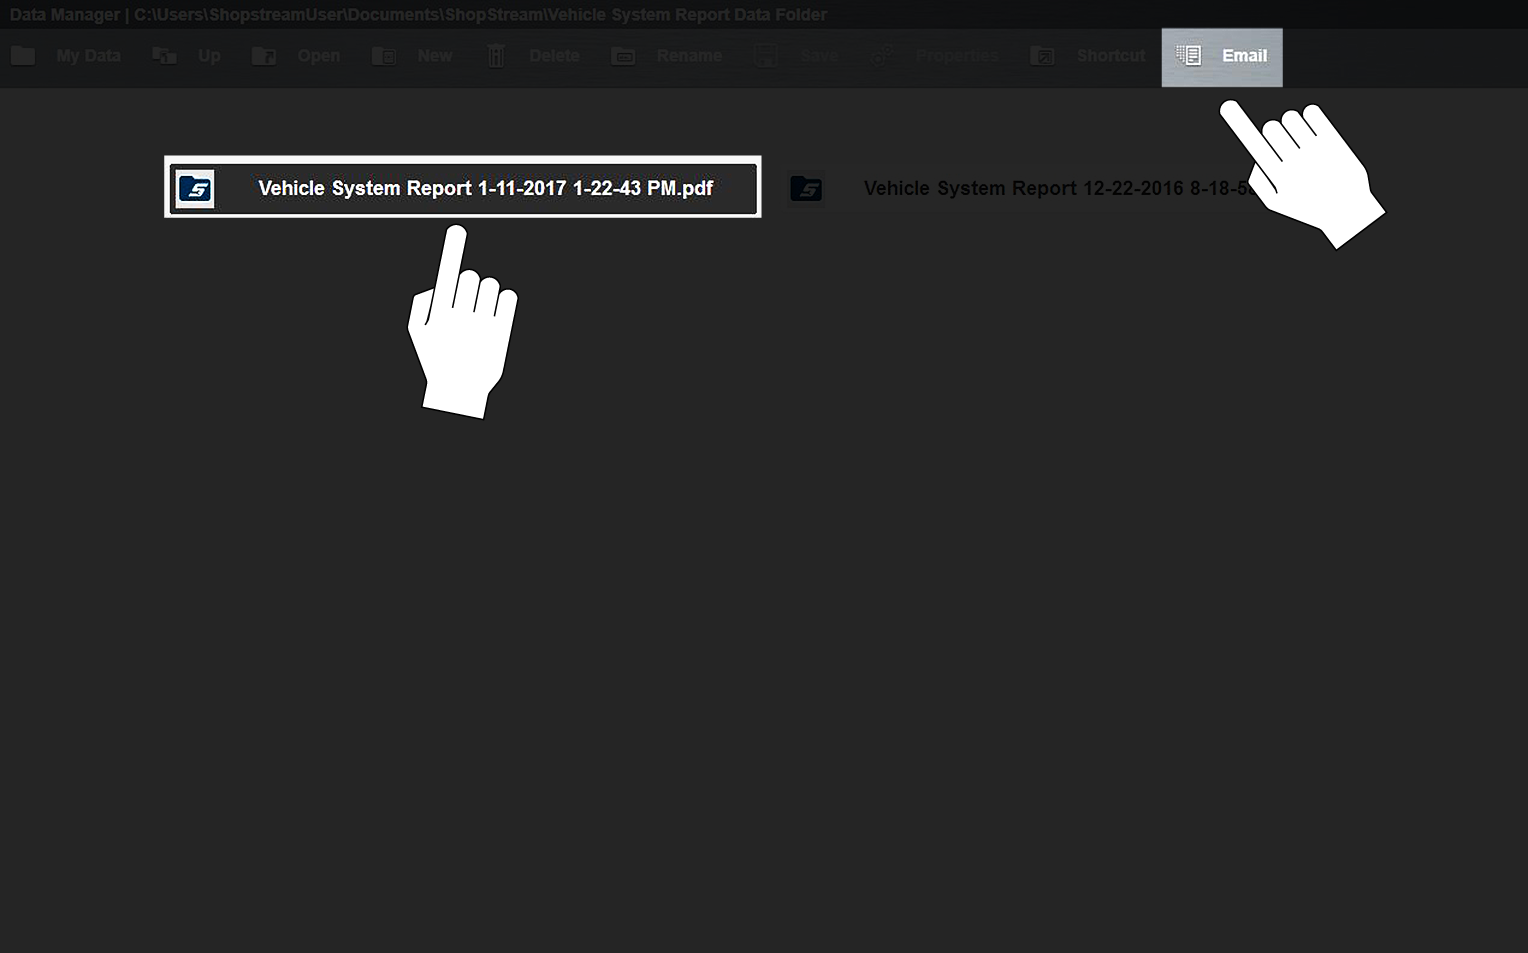
| 1. | From the Data Manager main screen, select a file from within one of the folders (e.g. Camera, Scanner Data, Scope Multimeter, etc). In this example. a Vehicle Systems Report was chosen from the Vehicle Systems Report Data Folder. |
| 2. | With the file highlighted, select Email from the toolbar. |
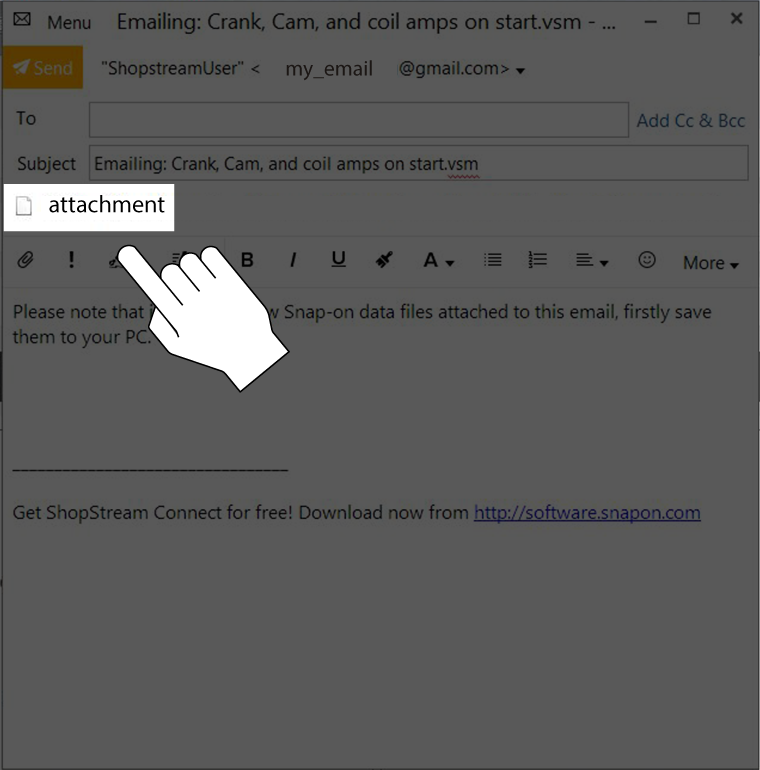
| 3. | A new e-mail message window will display onscreen . |
| 4. | Enter the e-mail address of the recipient, and any other information needed. |
| 5. | Select the Send icon to send the e-mail. |
You must have an Internet connection to send e-mail.
Vehicle System Report Viewer
= Home Screen > Data Manager - (Vehicle System Report Data Folder)
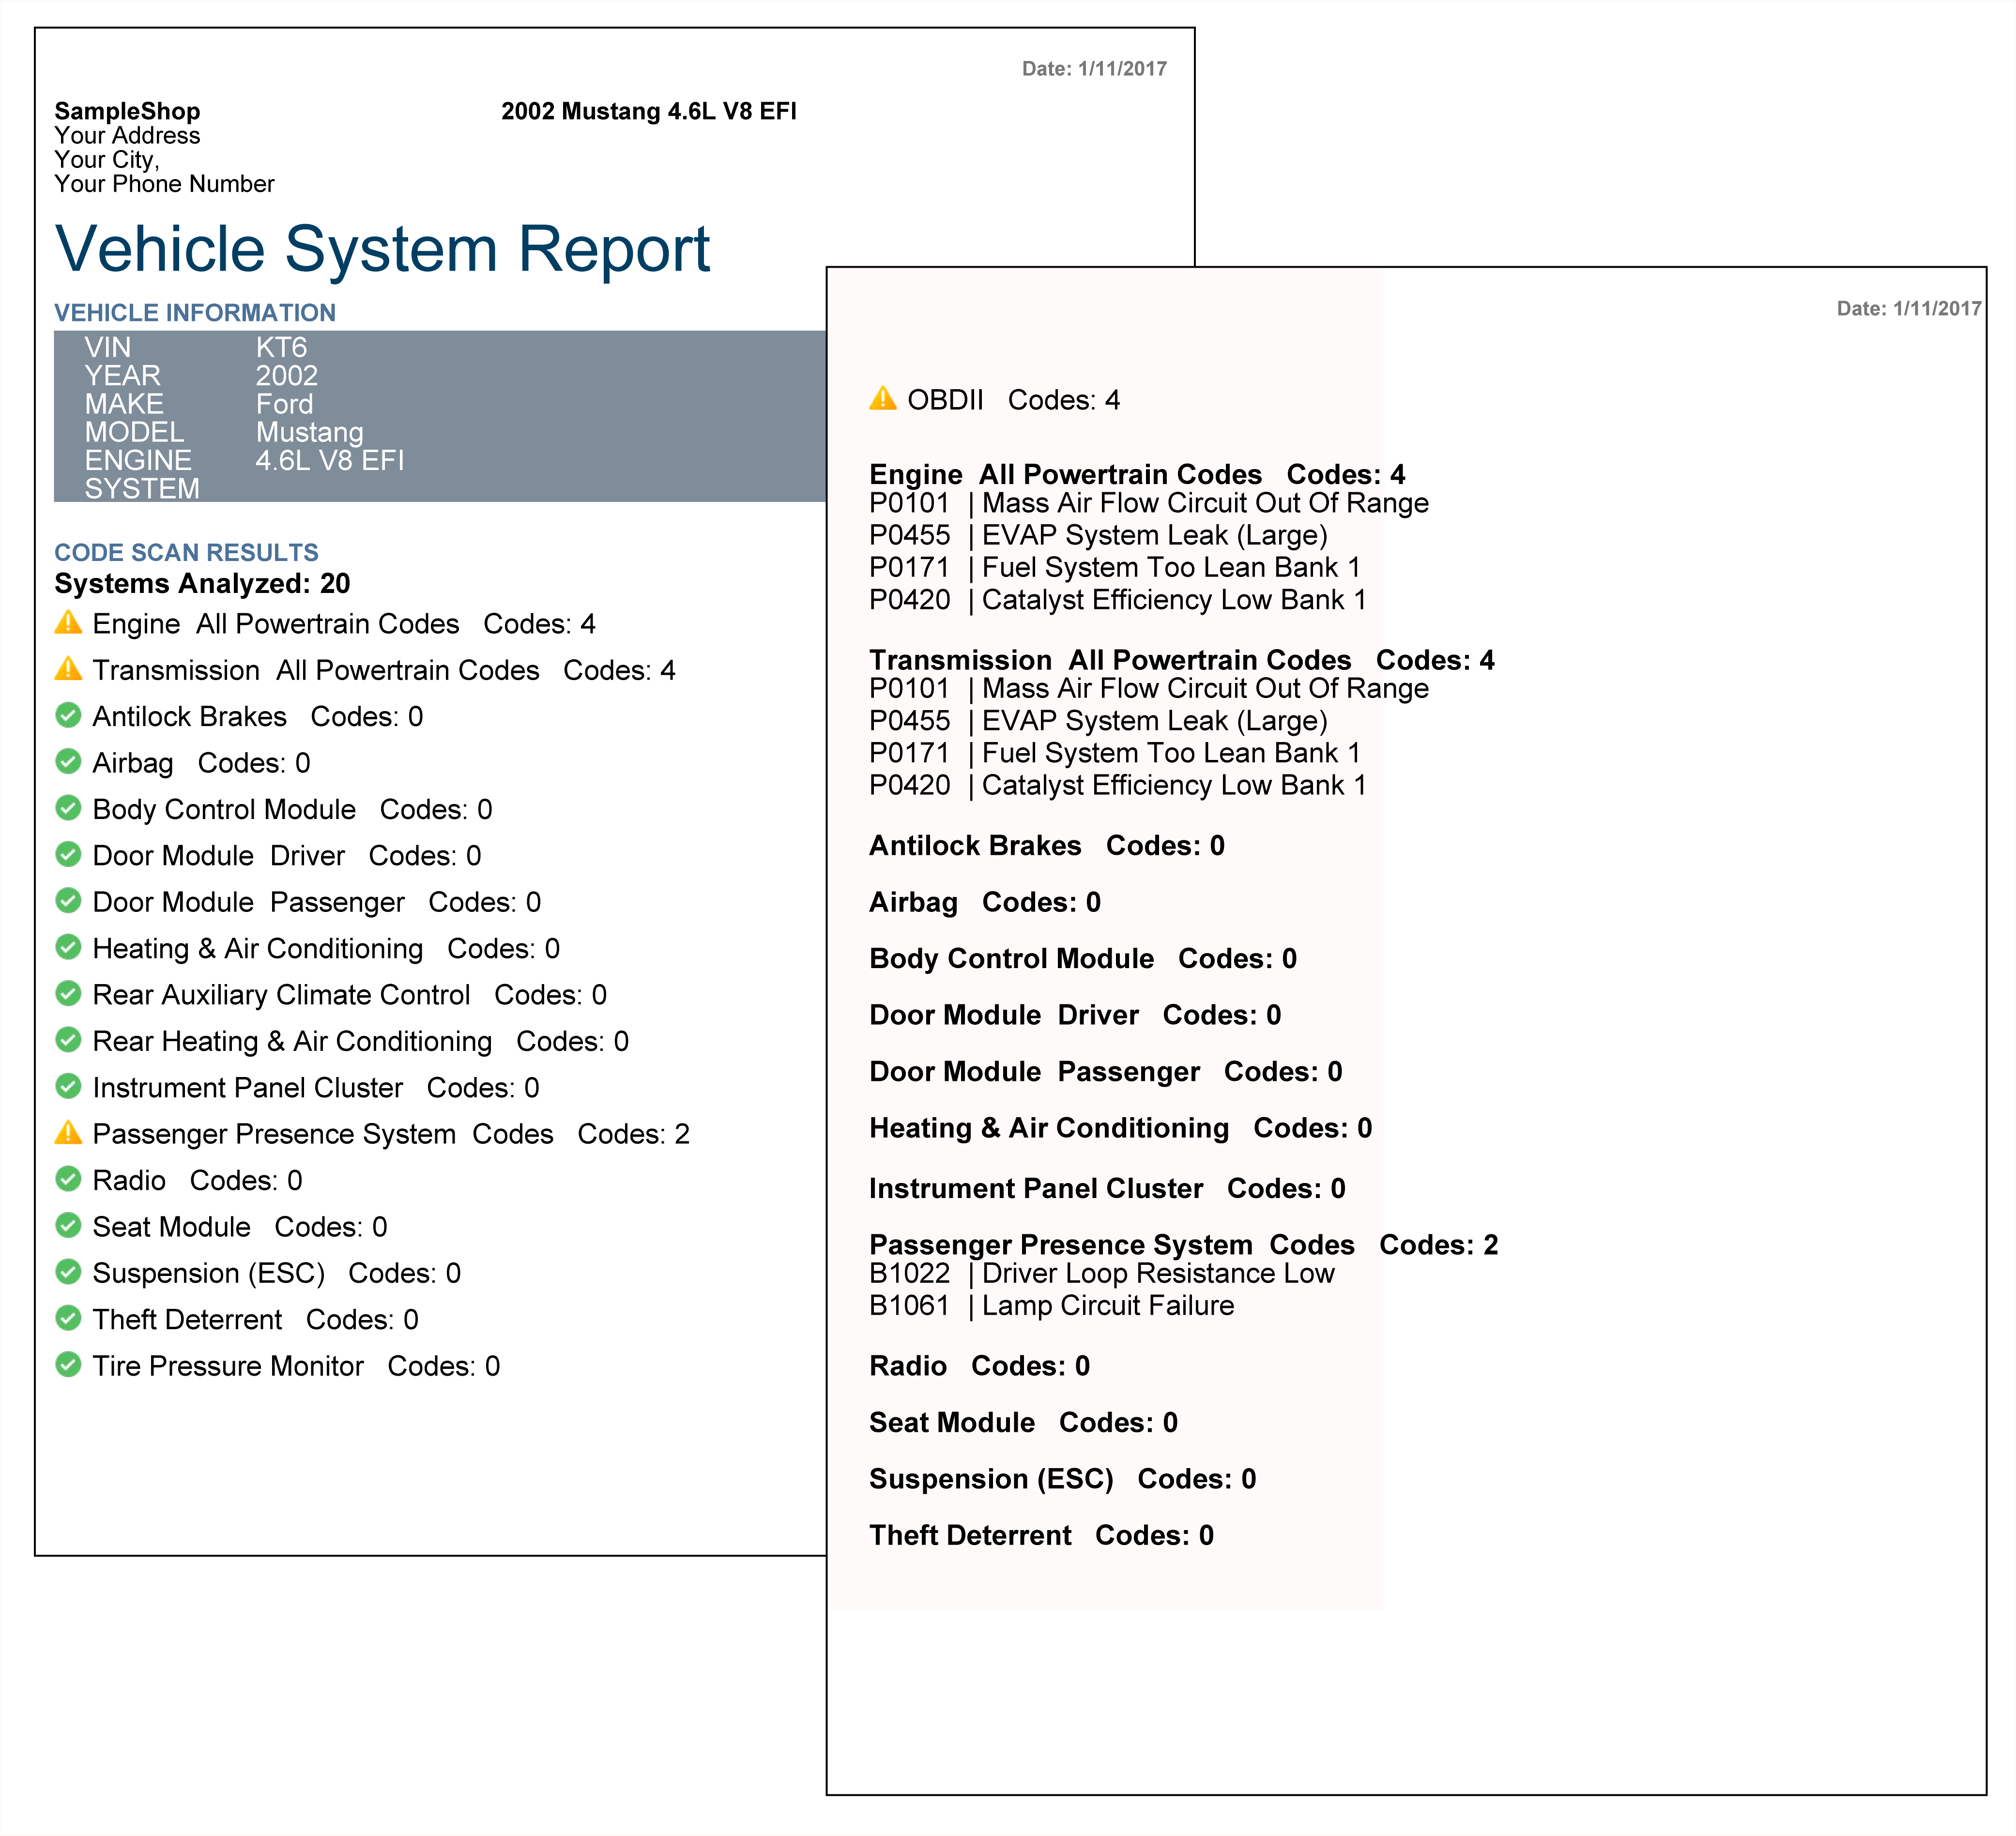
Code Scan reports are saved in .pdf format and are viewable by opening them from the Vehicle System Report Data Folder in the Data Manager folder panel, or from within the Vehicle System Report Data folder in the Windows My Documents > ShopStream folder.
The built-in PDF viewer allows you to open, view and print the report.
The following example shows a typical report.
To hide/show the timestamp (time of day) located next to the date (upper right), see Code Scan (Timestamp).
To print, see Printing / Printer Setup.
Image Viewer
= Home Screen > Data Manager - (ADAS Report Data Folder)
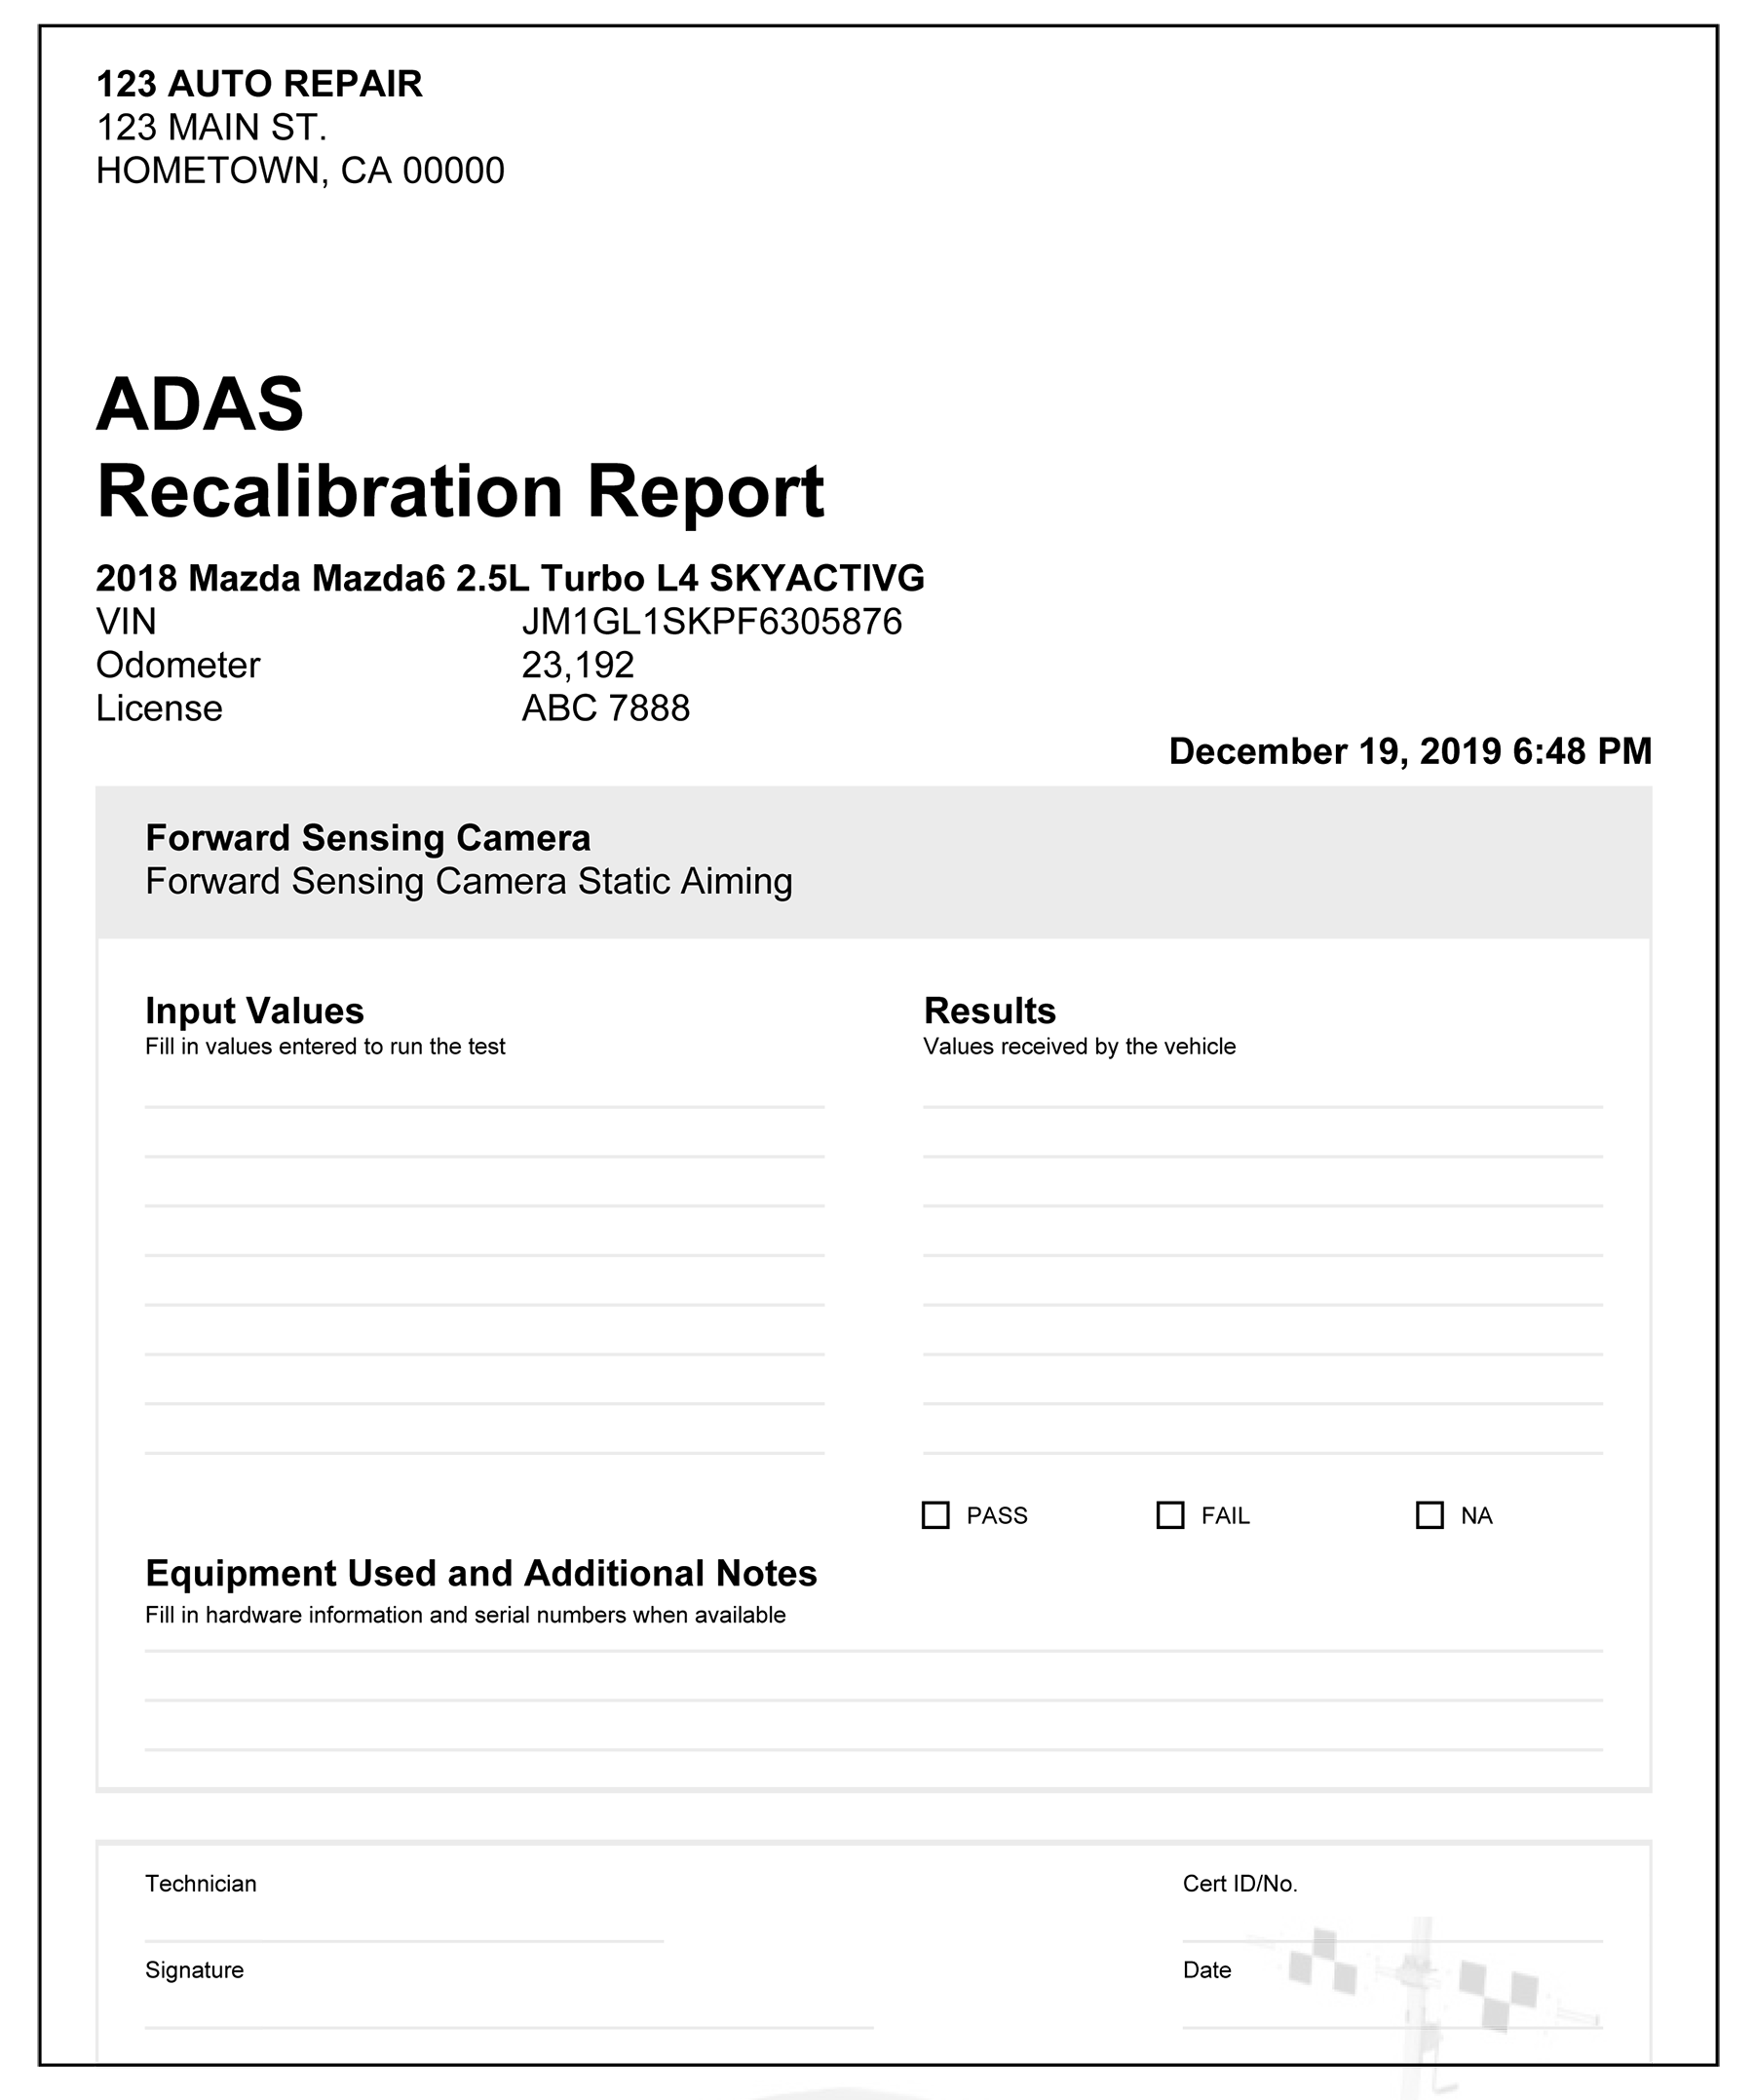
ADAS reports are saved in .pdf format and are viewable by opening them from the ADAS Report Data Folder in the Data Manager folder panel, or from within the Vehicle System Report Data folder in the Windows My Documents > ShopStream folder.
The built-in PDF viewer allows you to open, view and print the report.
To print, see Printing / Printer Setup.
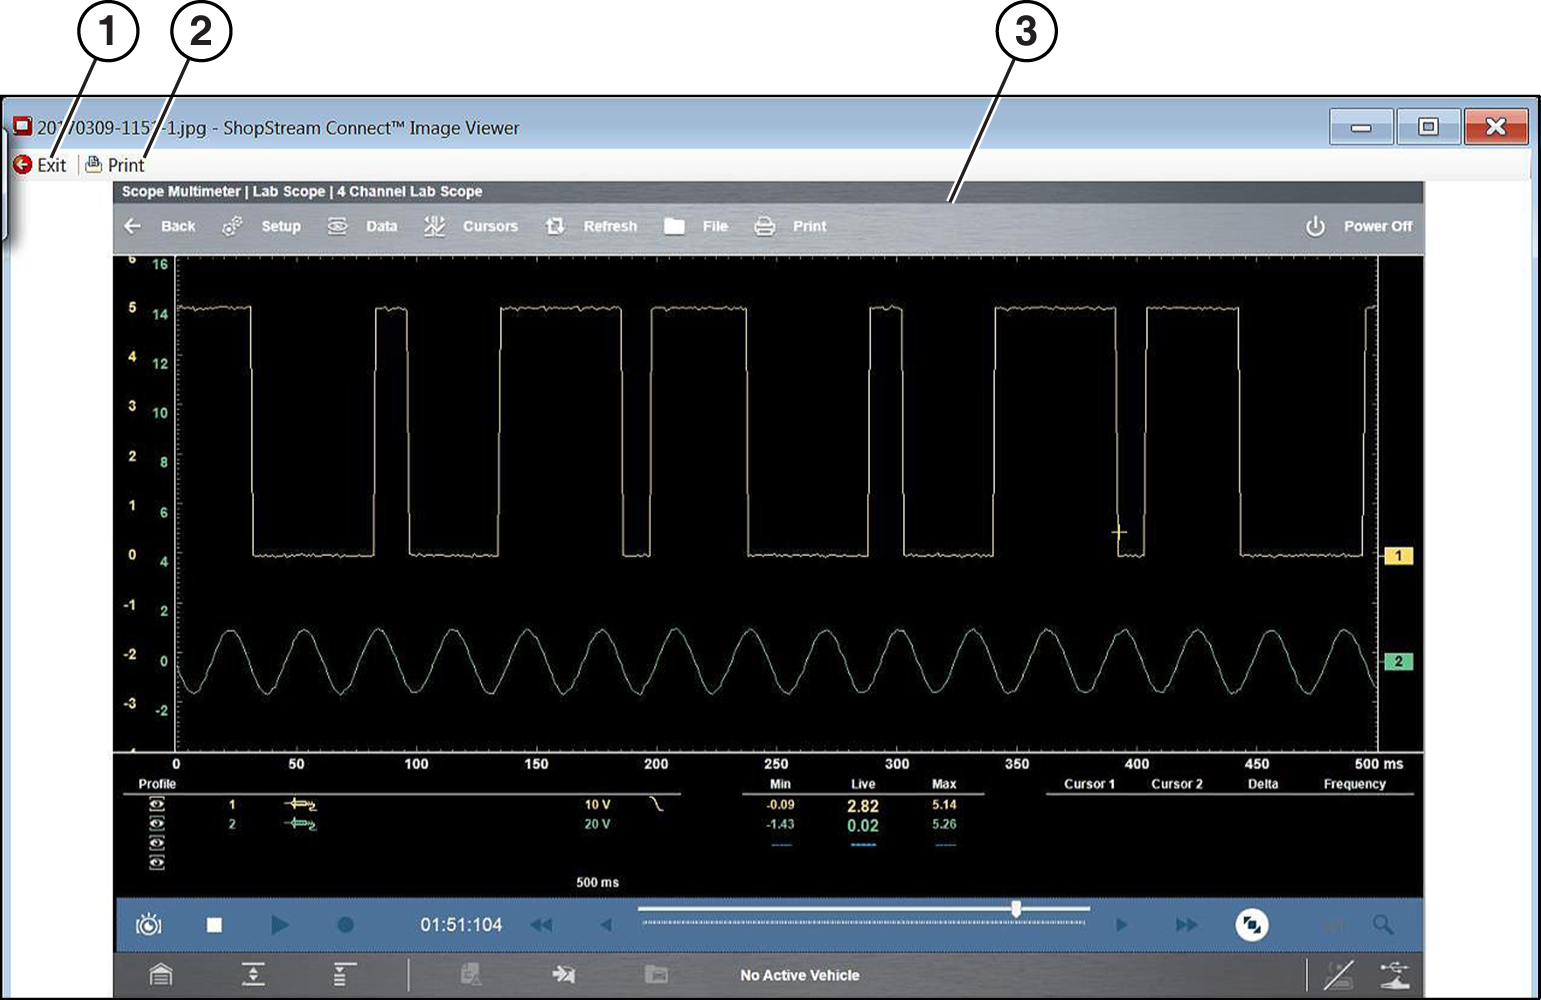
Screenshots and photos taken using the built-in camera are saved in .jpg format and are viewable by opening them from the Screenshots and Images folders in the Data Manager folder panel, or from within the Windows My Documents > ShopStream >Screenshots folder.
The built-in Image Viewer allows you to open, view and print image files and screenshots.
Image files can also be viewed on most PCs.
| 1. | Exit - closes the Image Viewer |
| 2. | Print - prints the image |
| 3. | Captured Screen Image |
Scanner DataViewer
Scanner data files are saved in a proprietary file format and are viewable by opening them from the Scanner Data Folder in the Data Manager folder panel, or from within the Windows My Documents > ShopStream > Scanner Data folder.
The built-in Scanner DataViewer allows you to open, play and print Scanner data files.
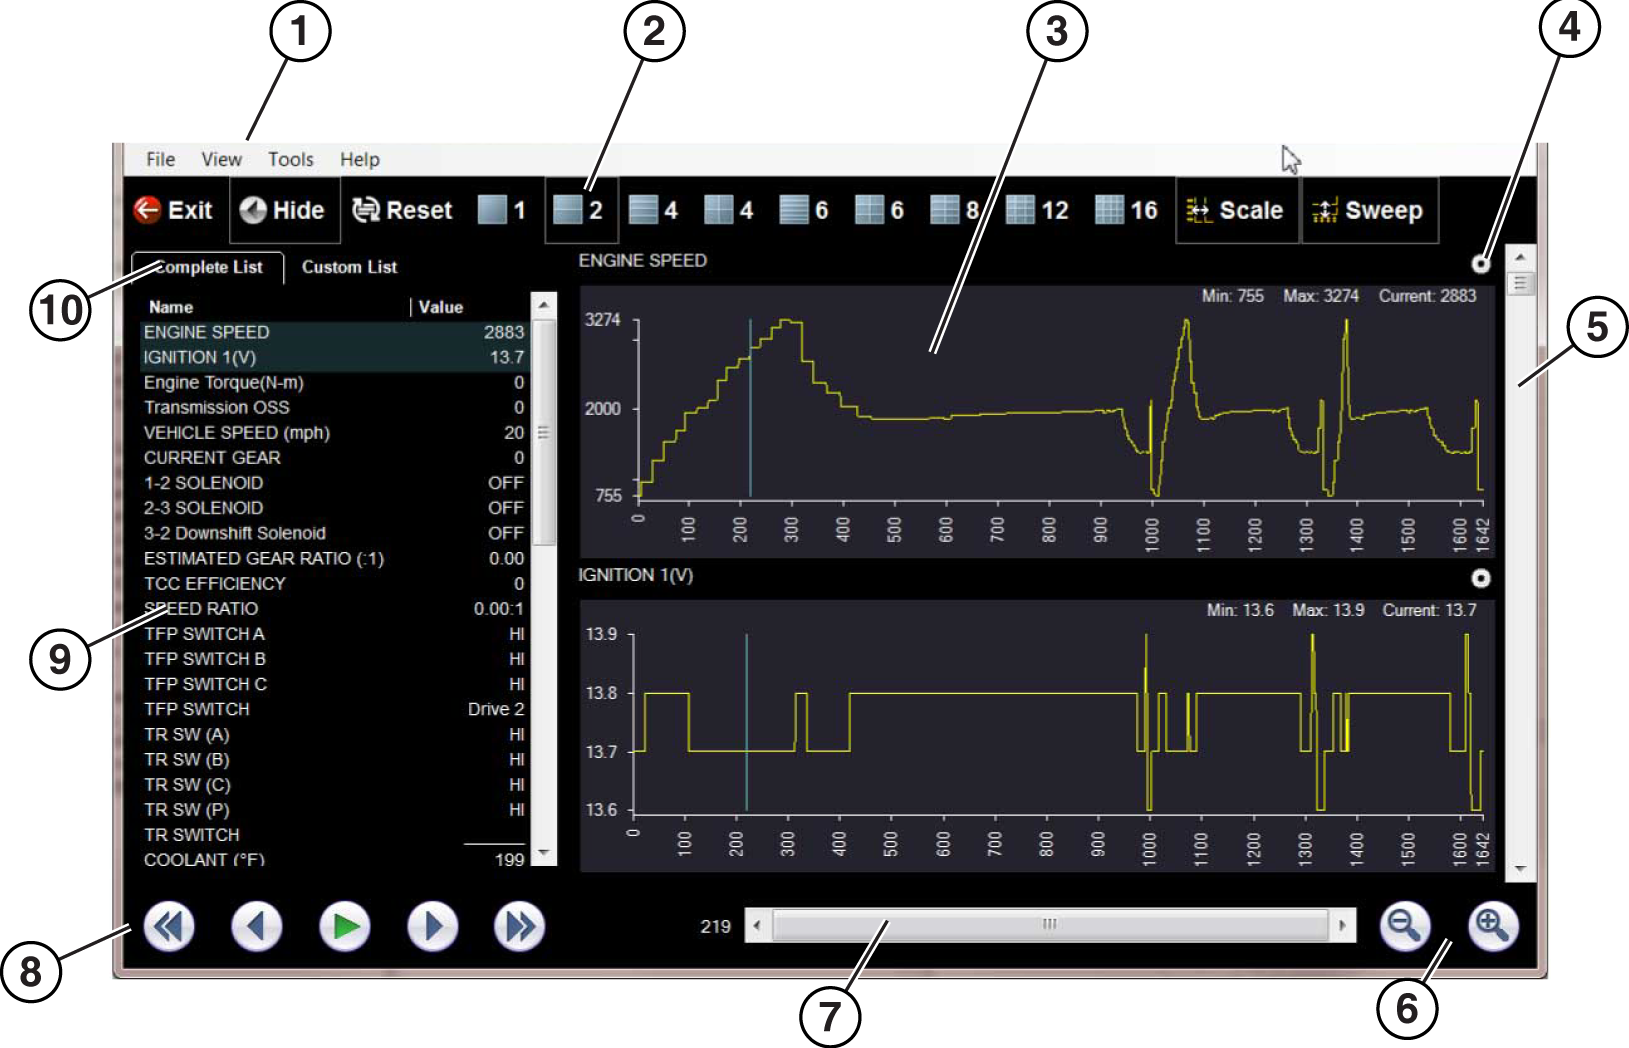
Scanner DataViewer - Opens .pids, .scm, .scs, .scp and .spm file extensions
Scanner Data Viewer
| 1. | Menu bar |
| 2. | Display toolbar |
| 3. | Graph display |
| 4. | Properties icon |
| 5. | Vertical Scroll bar |
| 6. | Zoom controls |
| 7. | Slider bar |
| 8. | Navigation toolbar |
| 9. | Parameter text list |
| 10. | Parameter configuration tabs |
Menu Bar
The menu bar at the top of the screen contains the File, View, Tools, and Help menus.
File Menu
The File menu offers the following selections:
| ● | Load—locate and open data files, launches a navigation window |
| ● | Print—print selected pids |
| ● | Print Preview—preview pids before printing |
| ● | Exit—closes Scanner DataViewer |
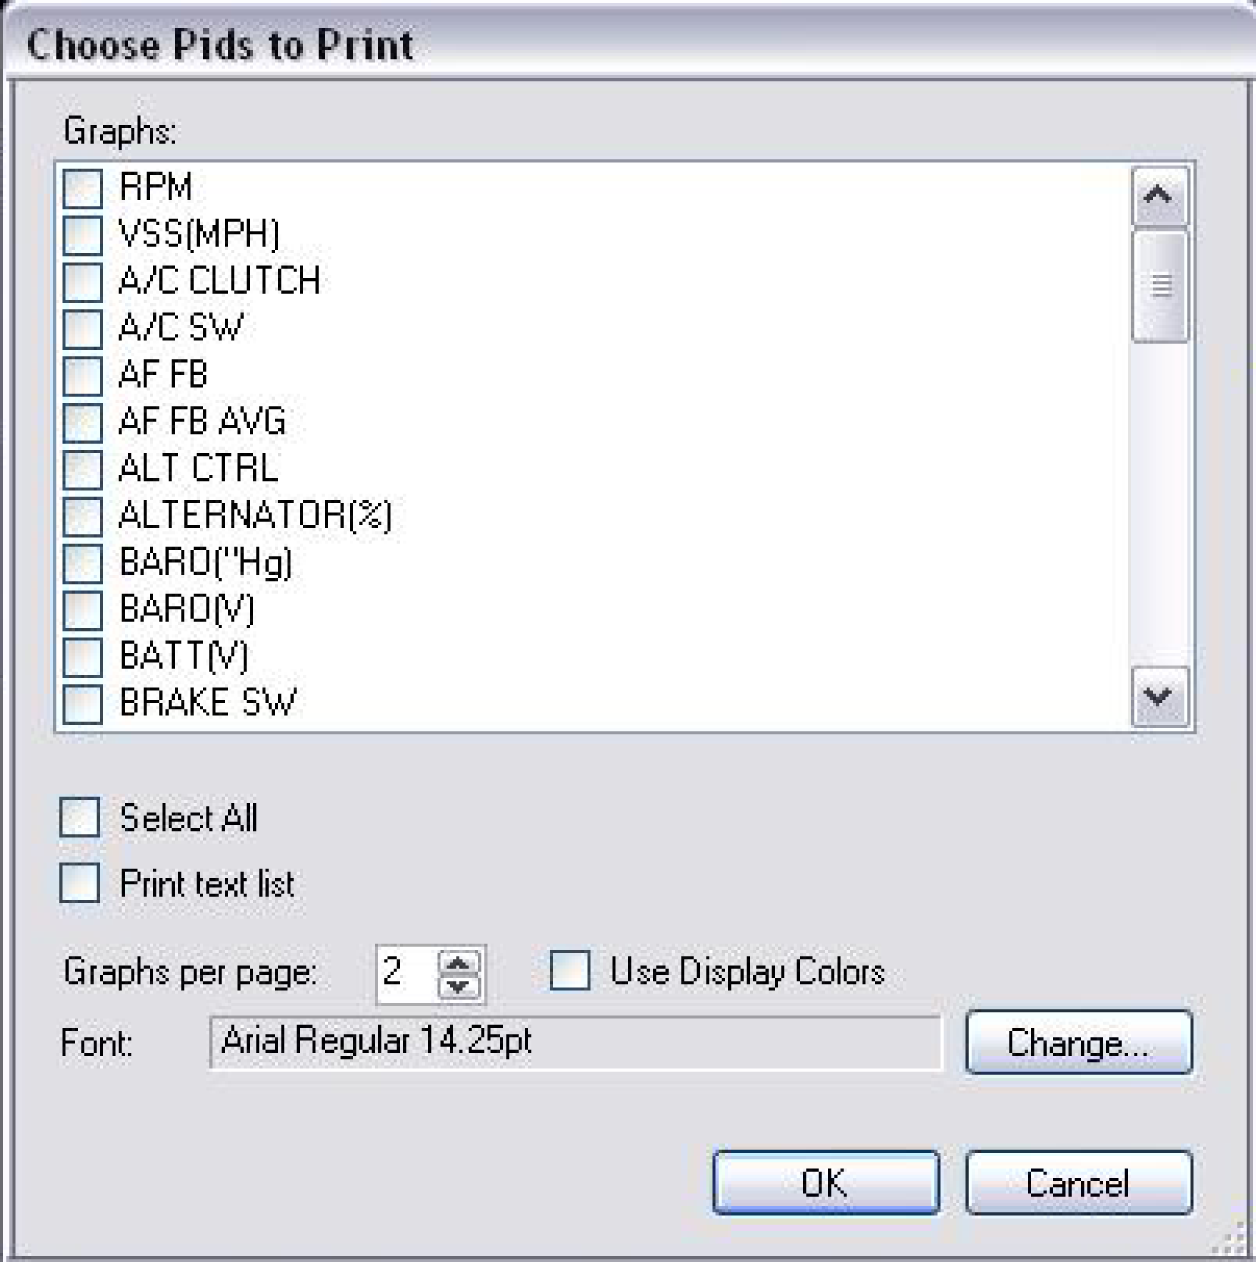
When Print or Print Preview is selected, a dialog box opens and allows you to define the printed output. Print settings include, print as graphs or text, which pids to include, number of pids per page, display colors, and the text font.
To print:
| 1. | Select the desired pids. A checked box indicates the pid will be printed. Select again to deselect the pid. |
| 2. | Select Change to modify the font, this opens a standard Windows font dialog box. |
| a. | Modify the font as desired. |
| b. | Select OK to close the font dialog box. |
| 3. | Once all selections are made, select OK. |
A print dialog box opens.
| a. | If Print was selected, the file is sent to the printer. |
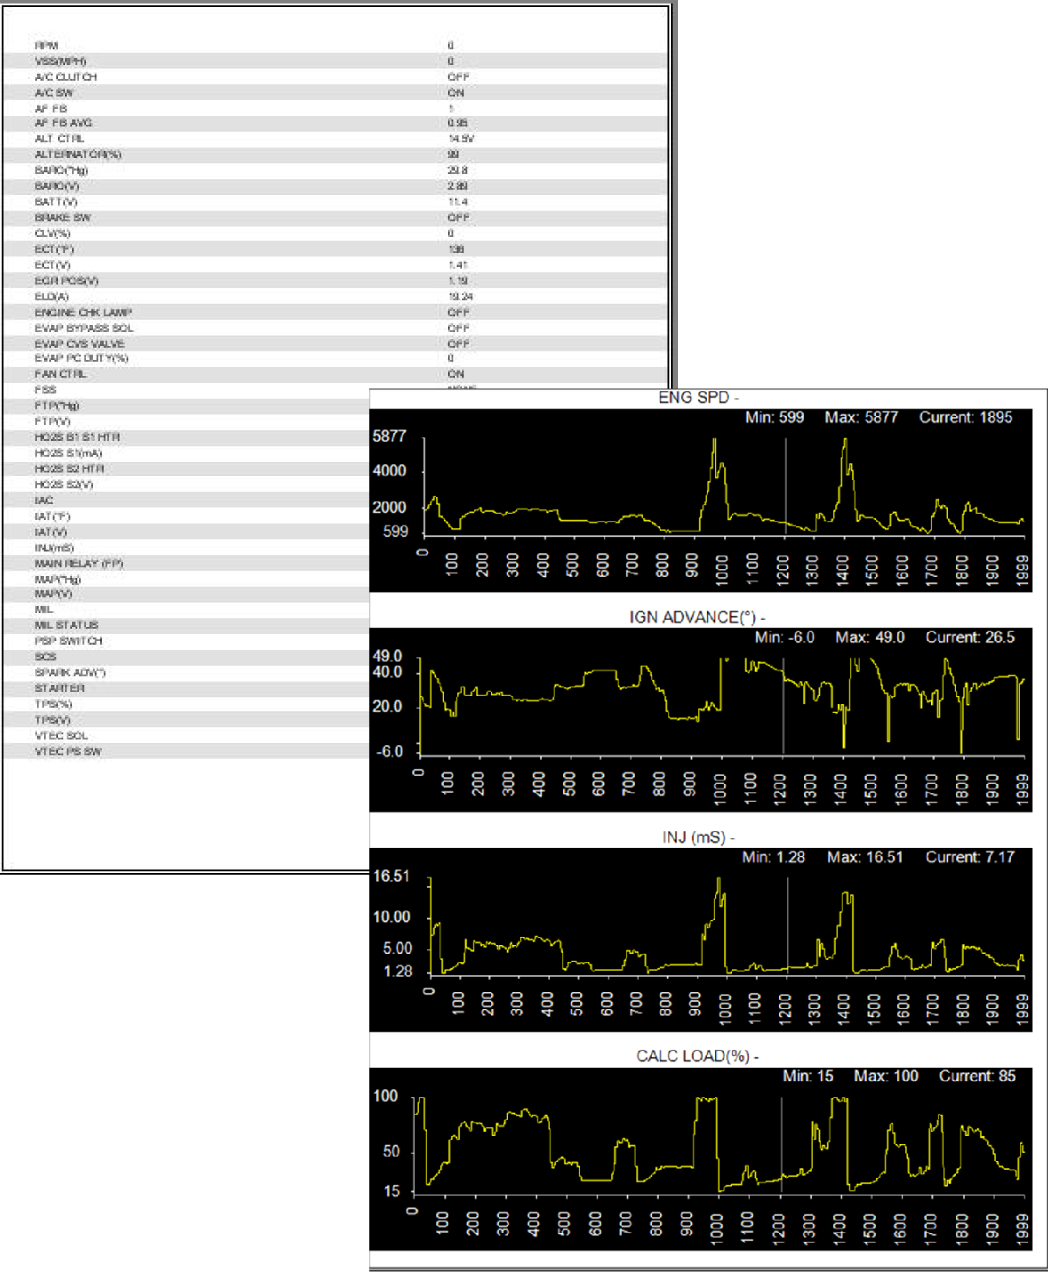
| b. | If Print Preview was selected, a preview window opens. Select the printer icon to send the file to the printer. |
Print preview window (text list and graphs examples)
View Menu
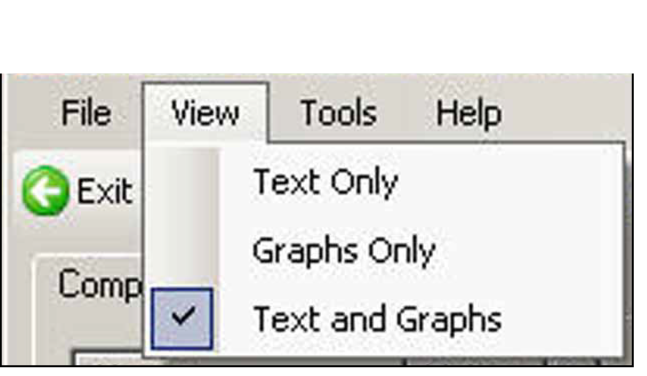
The View menu allows you to change how data is displayed on the screen.
Select from the following menu options:
| ● | Text Only—shows all parameters and their values as text only |
| ● | Graphs Only—shows all parameters as graphs only |
| ● | Text and Graphs—shows all parameters and their values as text in the left panel of the screen, and shows them as graphs in the right panel of the screen |
Tools Menu
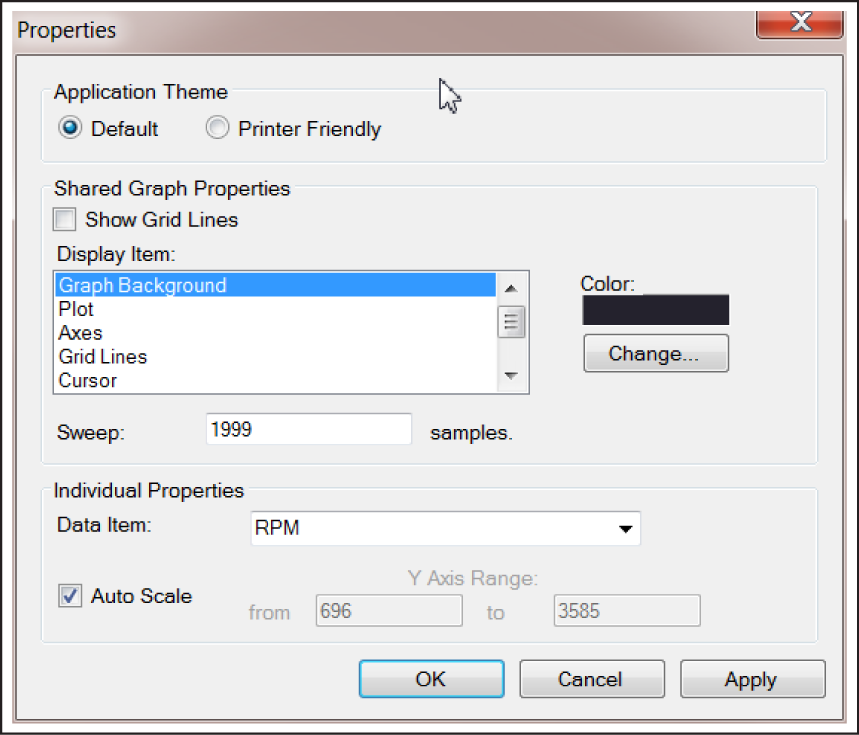
The Tools menu opens the Properties dialog box which has two sections ; Shared Graph Properties and Individual Properties. Shared Graph Properties apply to all graphs, and Individual Properties apply to the selected graph only.
Properties dialog box selections include:
| ● | Grid Lines—when selected, a line displays at each major division of the graphs. |
| ● | Display Item—use to view the display color of the listed items. Highlight an item and the current color appears in the Color box. |
| ● | Change—use to change the color of the highlighted item, select to open a color palate. |
| ● | Sweep—use to adjust the number of data frames that appear on the screen (zoom in or out), highlight and type in the desired number. |
| ● | Reset Colors—use to restore the default color settings. |
| ● | Data Item—use this pulldown menu to select individual graphs for modification. |
| ● | Auto Scale—minimum and maximum (Y axis) values automatically adjust to the signal when the box is checked, uncheck the box if you want to custom set the values. |
| ● | Y Axis Range—use to type desired minimum (from) and maximum (to) values in the selection boxes. This field is only active when Auto Scale is deselected. |
| ● | OK—applies the changes and closes the properties dialog box. |
| ● | Cancel—closes the properties dialog box without making changes. |
| ● | Apply—applies the changes and leaves the properties dialog box open. |
The Properties icon on each graph also opens the Properties dialog box (Scanner DataViewer).
Help Menu
See Help for additional information.
Display Toolbar
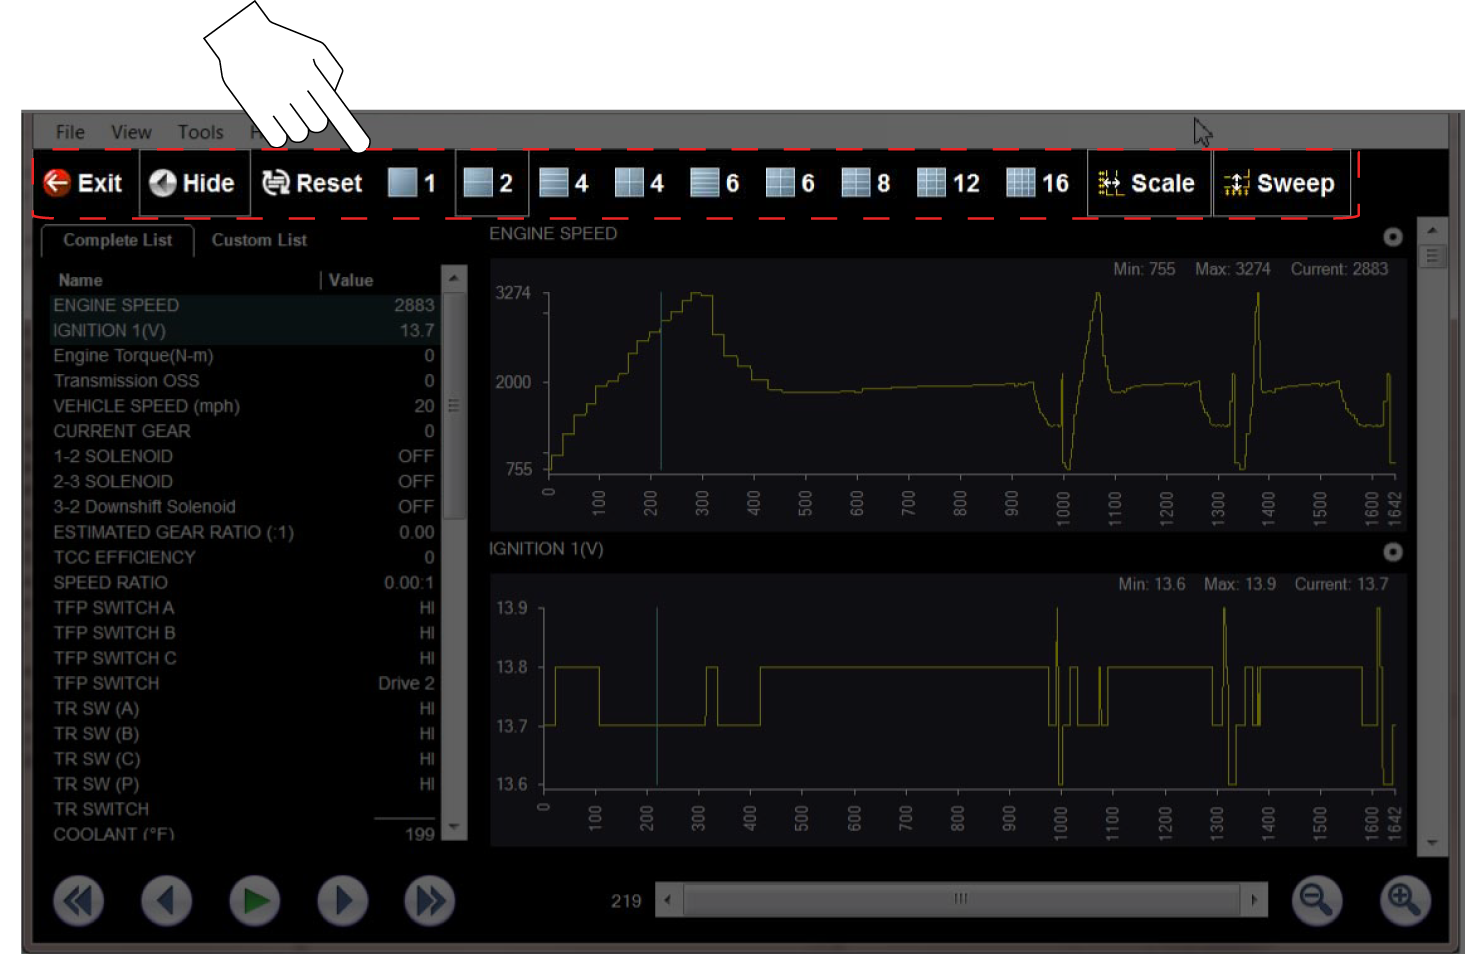
The Display toolbar provides the following controls .
| ● | Exit—closes Scanner DataViewer. |
| ● | Hide PID List—toggles display between parameter text and graph views. |
| ● | Display Views (1 to 16)—determines how many graphs display at a time. |
| ● | Scale—switches the scale values shown to the left of the graph off and on. |
| ● | Sweep—switches the sweep values shown below the graph off and on. |
Display toolbar
Navigation Tools
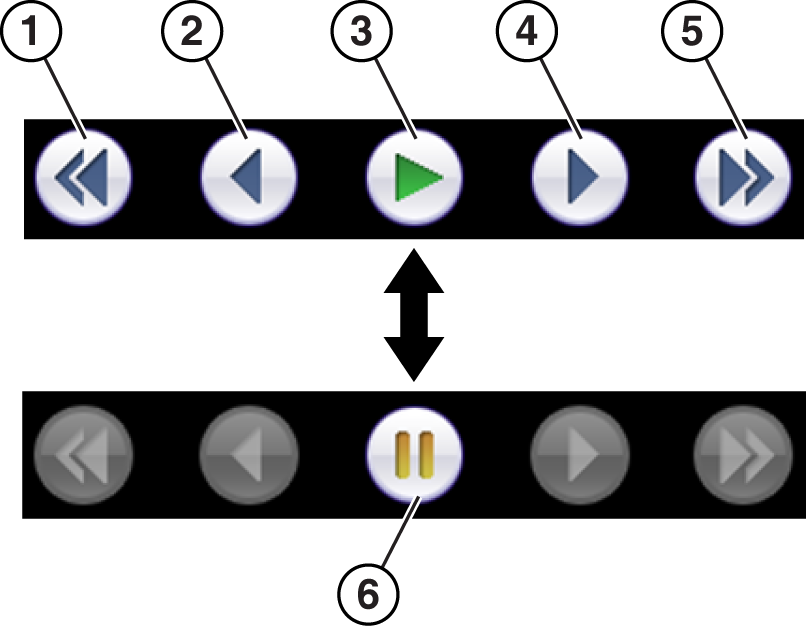
Playback Controls
The playback controls allow you to navigate through saved data.
Skip Back—Allows backward movement in multiple steps.
Step Back—Allows backward movement in singular steps.
Play—Select to play.
Step Forward—Allows forward movement in singular steps.
Skip Forward—Allows forward movement in multiple steps.
Pause—Select to pause playback.
Playback controls
Zoom Controls
The zoom controls allow you to incrementally increase or decrease the screen magnification.
Zoom controls
Slider / Scroll Bars and Cursor
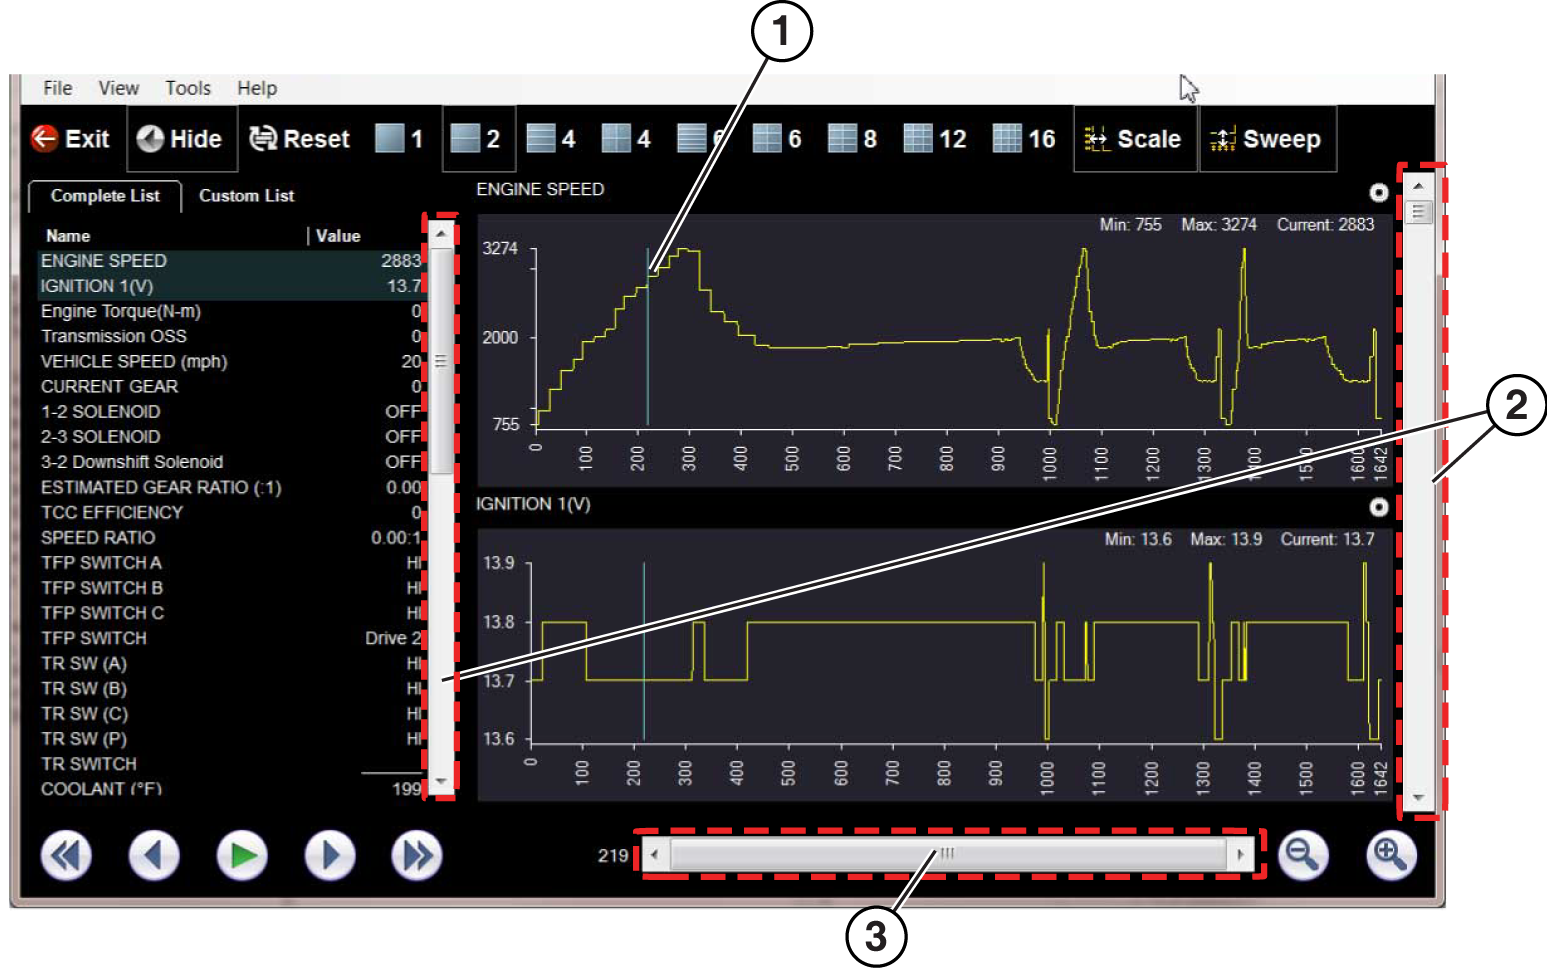
Use the slider bar to quickly navigate through the data. During playback the number displayed on the left side of the slider bar indicates the current position of the cursor in the data file. The cursor can be repositioned during playback or when paused by selecting and dragging.
Use the scroll bar (right side) to vertically scroll through the parameter list and graphs.
| 1. | Cursor |
| 2. | Scroll bar |
| 3. | Slider bar |
Customizing the Display
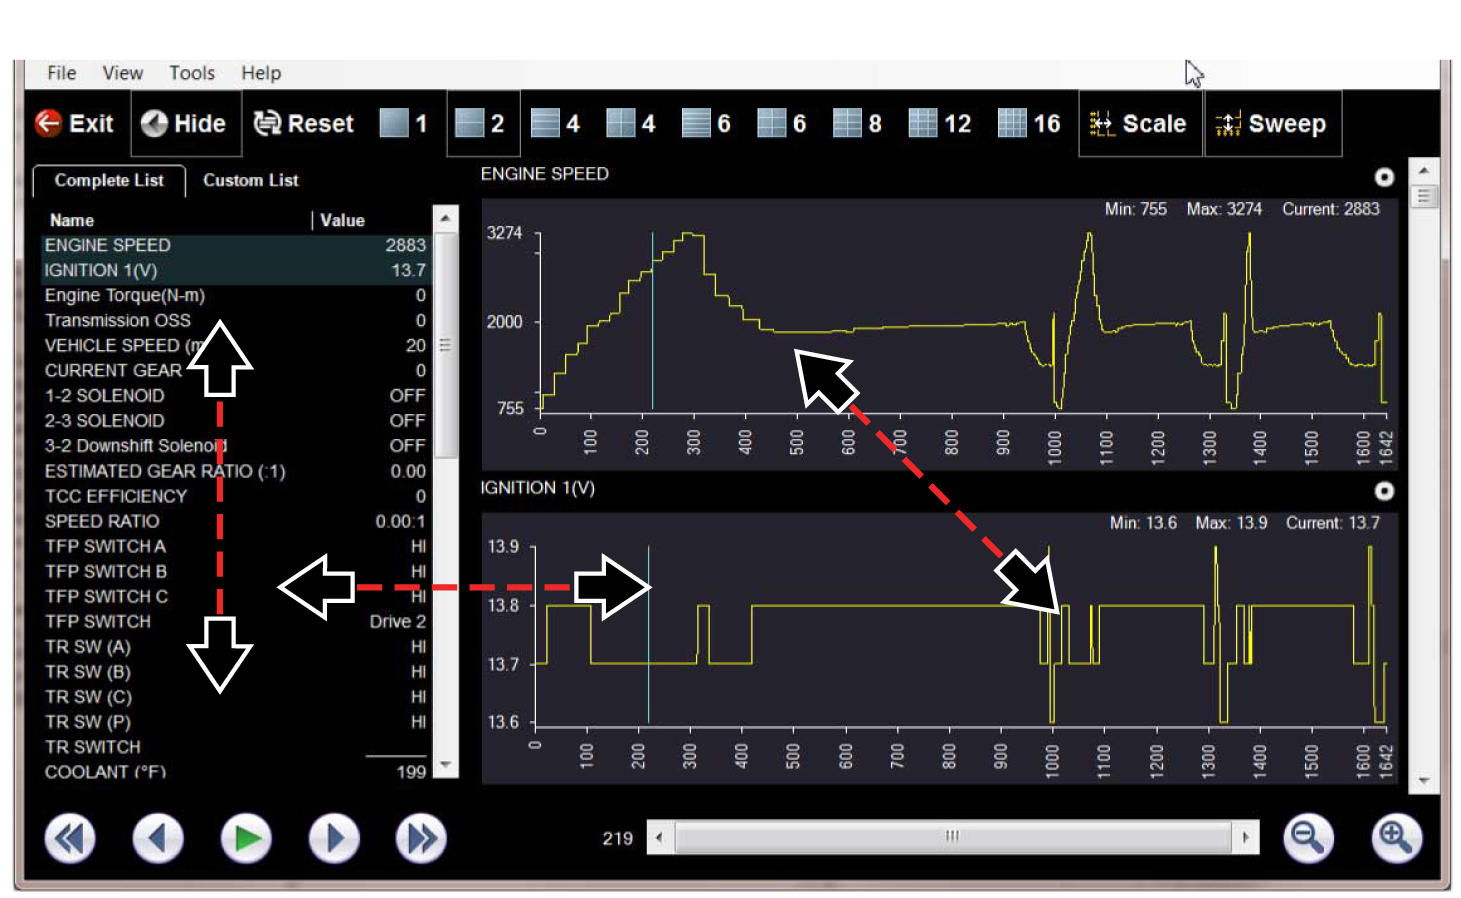
The parameter text list (left side) displays parameter names and current values.
The display can be customized by selecting and dragging parameters from the text list or graph display to a different location in the text list or in the graph display. The highlighted parameters in the text list indicate which parameters are displayed as graphs.
The parameter text list is sortable by name and value. Select Name or Value at the top of the list to change the sorted view.
Customizing the Parameter List
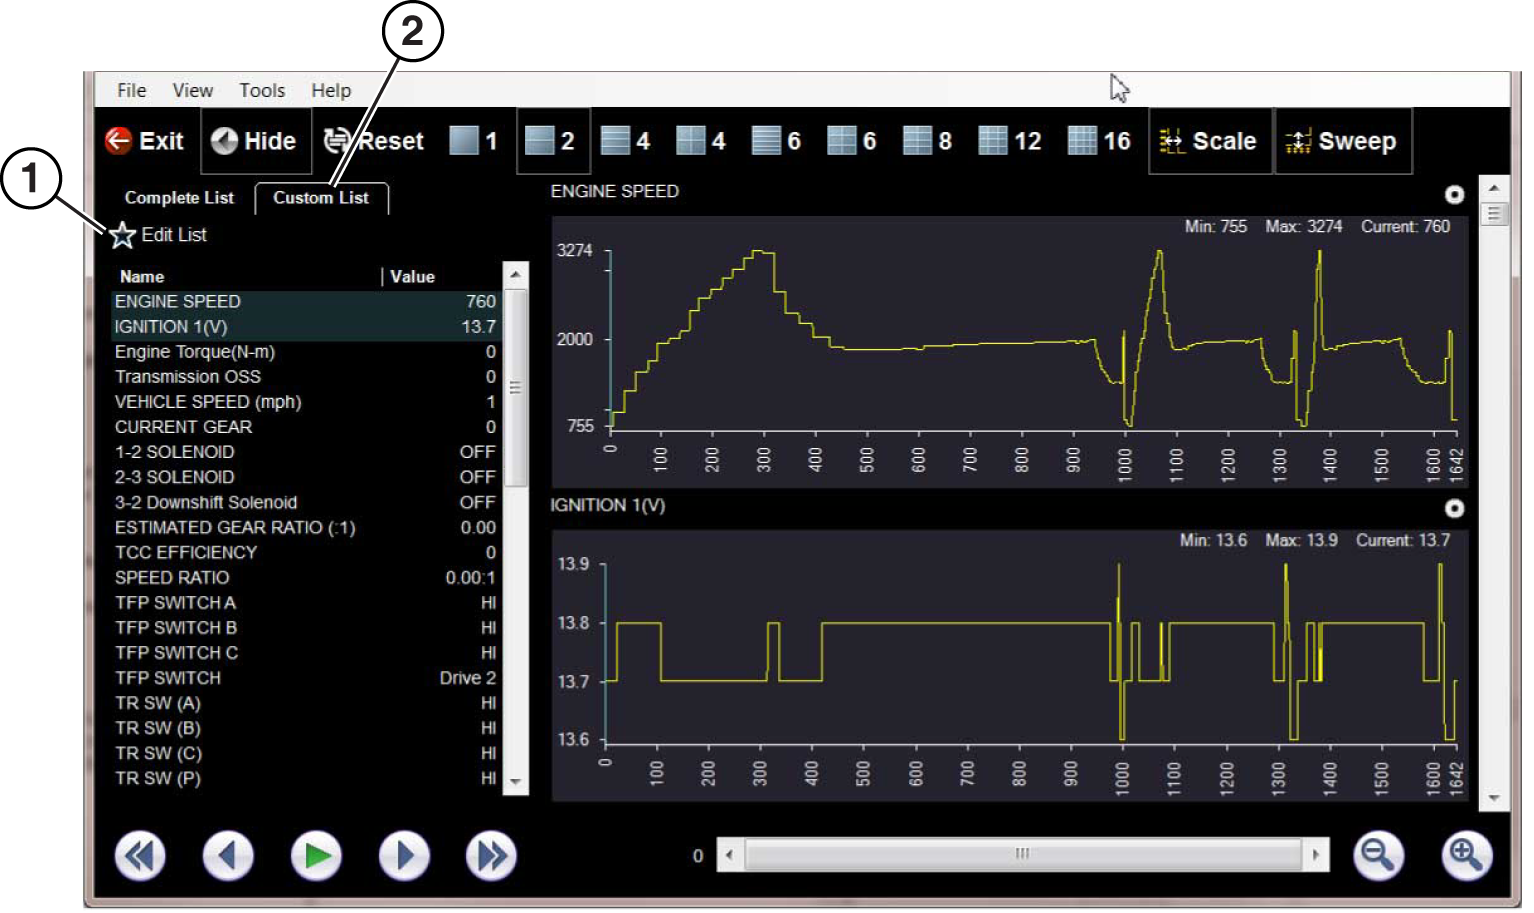
The parameter configuration tabs allow you to choose between displaying all available parameters (Complete List), or only those from a (Custom List).
To customize the parameter list:
| 1. | Select the Custom List tab. |
| 2. | Select Edit List in the custom window. |
| 1. | Edit List |
| 2. | Custom List tab |
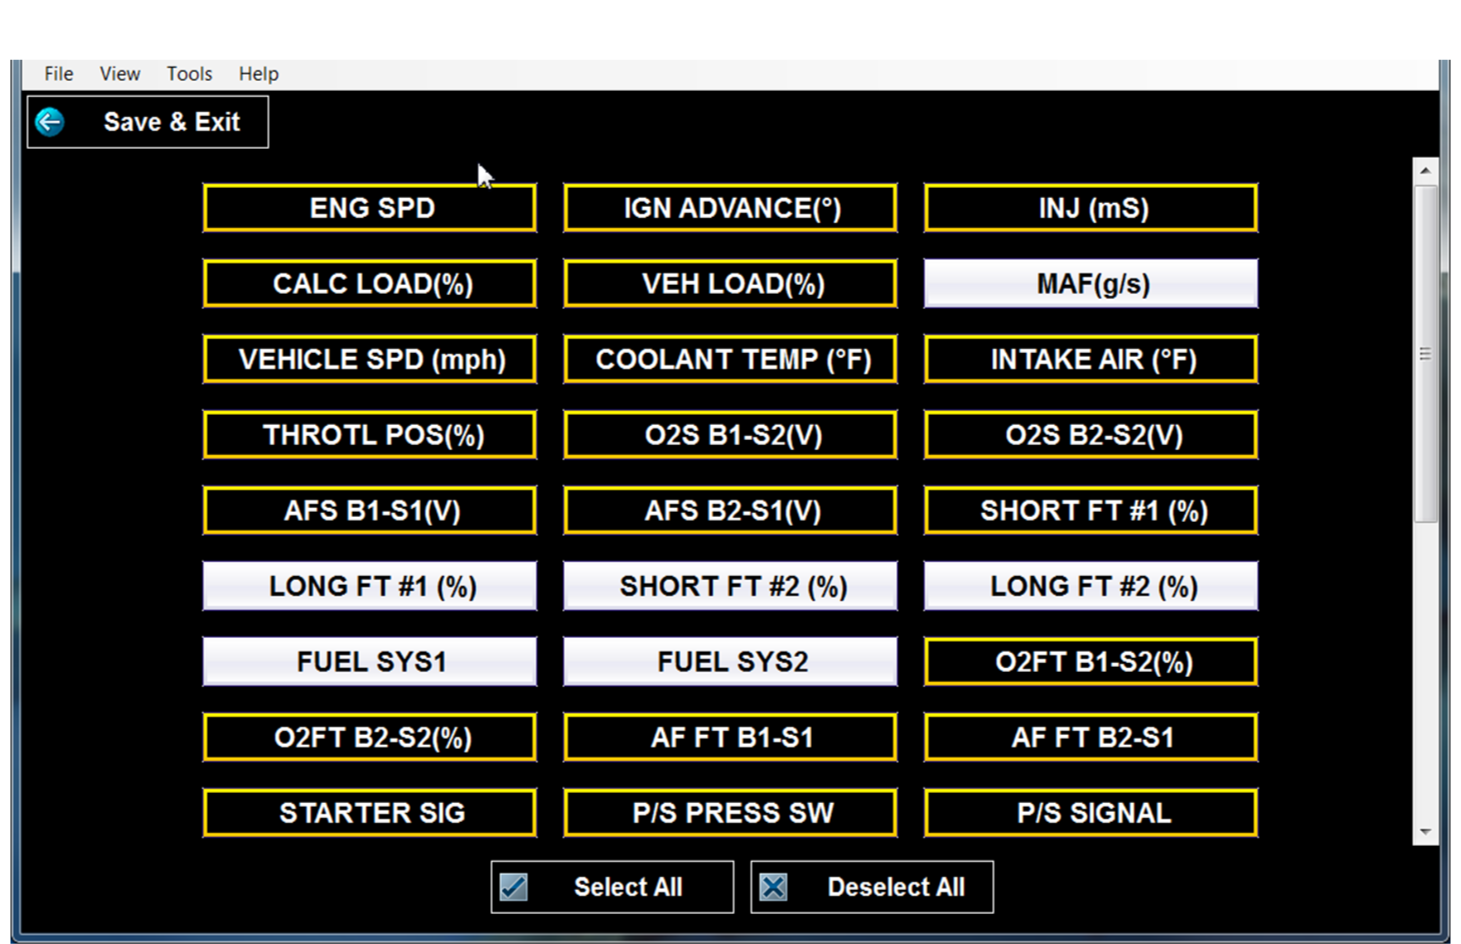
A list of available parameters displays .
| 3. | Select the parameters to include in your custom list. Select All and Deselect All controls are also available to assist in the selection process. |
Creating a custom parameter list
| 4. | Select Save & Exit to close the window. |
Only the parameters selected in your custom list are displayed.
Scope File Viewer
Scope data files are saved in a proprietary file format and are viewable by opening them from the Scope Multimeter and CTM (component test meter) Data Folders in the Data Manager folder panel, or from the Windows My Documents > ShopStream > Scope Multimeter Data folder.
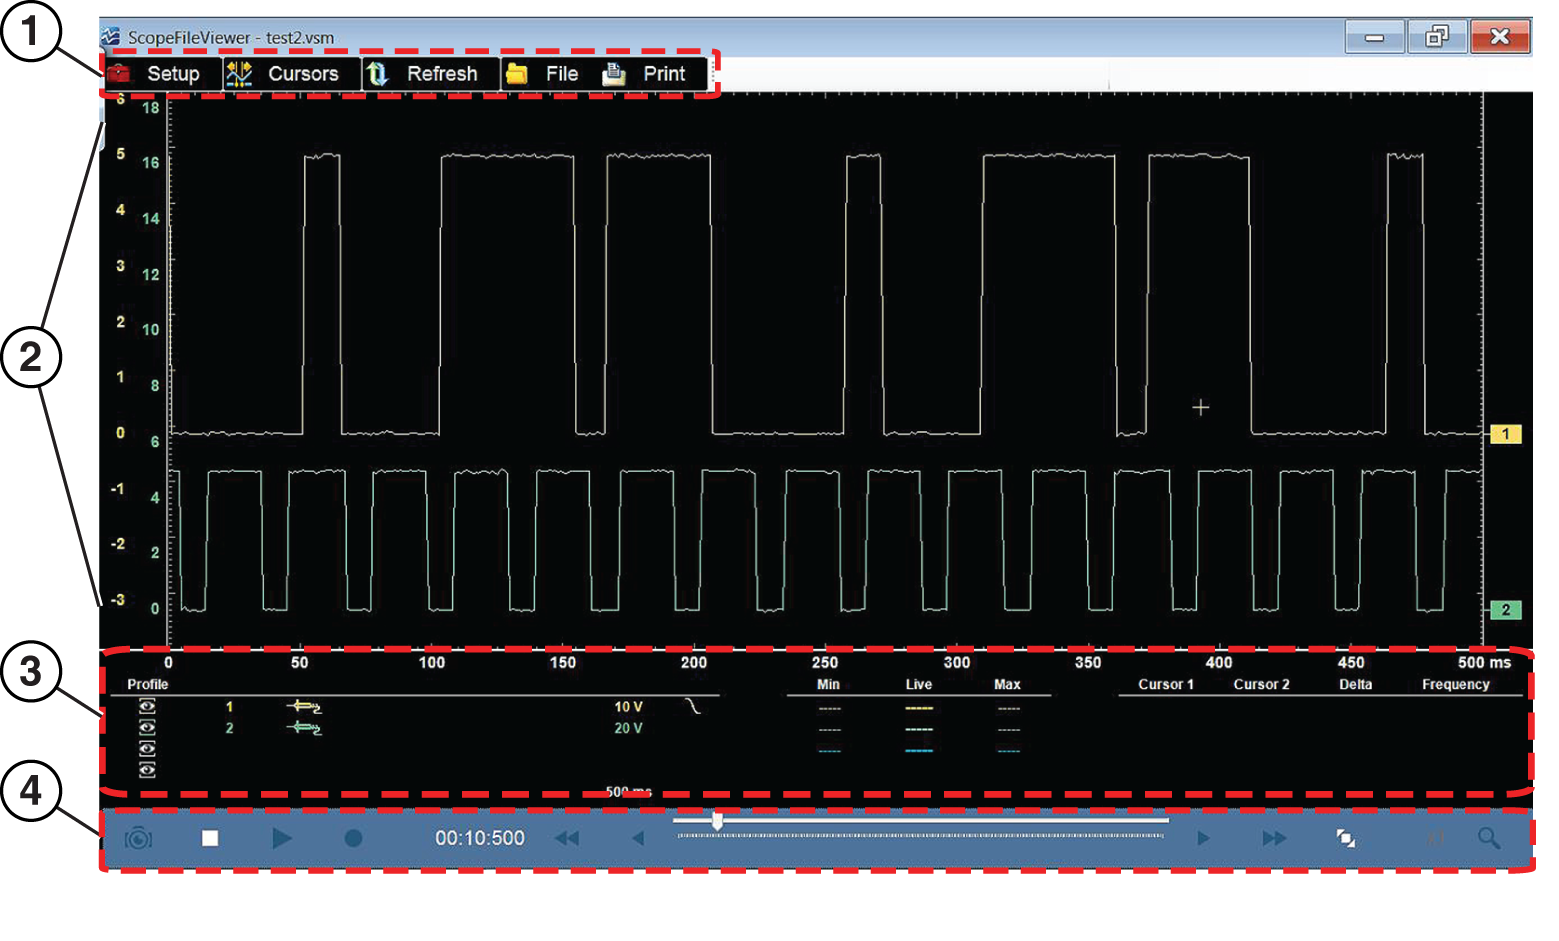
The built-in Scope File Viewer allows you to open, play and print recorded trace signals captured on your diagnostic tool.
Many of the navigation features are similar to those used in the operation of the Scope / Multimeter, see Record/Playback Control Toolbar. Some Scope File Viewer icons may not be available or grayed out, this is normal as those features are only applicable when viewing live trace signals.
| 1. | Toolbar - contains control icons |
| 2. | Main Body - displays recorded trace results |
| 3. | Controls Panel - contains the channel/trace settings |
| 4. | Playback Control Toolbar - contains playback and display controls |
ShopStream Connect™ (Alternative Viewer)
Saved data files are intended to be viewed using the built-in proprietary viewers within Data Manager and are not viewable on a PC, however ShopStream Connect can be installed on a PC as an alternative way to view data files.
ShopStream Connect is PC-based program that allows you to manage, view, and print data files using a PC. ShopStream Connect is a free program available for download from our website: http://diagnostics.snapon.com/ssc
